Spatial Analysis of Road Crashes and Economic Development of Territory: The Case of the Russian Federation
Corresponding email: rodionova.mariia@yandex.ru
Published at : 17 Jul 2025
Volume : IJtech
Vol 16, No 4 (2025)
DOI : https://doi.org/10.14716/ijtech.v16i4.7423
Rodionova, M, Skhvediani A, Kudryavtseva, T & Kapski, D 2025, ‘Spatial analysis of road crashes and economic development of territory: the case of the Russian Federation’, International Journal of Technology, vol. 16, no. 4, pp. 1167-1178
| Maria Rodionova | Graduate school of transport, Peter the Great St. Petersburg Polytechnic University, Saint – Petersburg, 195251, Russia |
| Angi Skhvediani | Graduate school of industrial economics, Peter the Great St. Petersburg Polytechnic University, Saint – Petersburg, 195251, Russia |
| Tatiana Kudryavtseva | Graduate school of industrial economics, Peter the Great St. Petersburg Polytechnic University, Saint – Petersburg, 195251, Russia |
| Denis Kapski | Department of transportation systems and technologies, Belarusian National Technical University, Minsk, 220013, Republic of Belarus |

Road accidents are a significant issue, leading to human, material, and economic losses. Many regions and countries have implemented various measures to improve traffic safety. However, these efforts have not eliminated all traffic-related fatalities and severe injuries. Even within a single country, the pattern of road accidents may vary due to spatial and socio–economic differences. Therefore, this research aimed to explore the relationship between regional socio–economic conditions and the dynamics of road accidents, emphasizing the importance of considering regional heterogeneity. The article further investigated the spatiotemporal dynamics of road accidents across 83 Russian regions during the period from 2015 to 2021. The modelling was conducted using Moran’s I spatial autocorrelation index and spatial econometrics models. The dependent variable was also defined as the number of road crashes with injuries per 100,000 people. Analysis of the spatial autocorrelation index showed a positive and significant spatial autocorrelation (at 5% level) in the number of road crashes with injuries per 100,000 people. Furthermore, the Global Moran’s I ranged from 0.152 to 0.278, indicating the presence of regional clustering in road crash rates. According to the Spatial Autoregressive with Fixed Effects (SAC-FE) model, the volume of gross regional product (GRP) per capita, the length of paved public roads per 1,000 people, and the level of innovative activity of organizations showed significance at 1% level both negative direct and indirect (spillover) effects on road accident density. Specifically, a 1% increase in these factors led to a direct decrease of 0.13, 0.04, and 0.024, respectively in road accident density, while the corresponding spillover effects were -0.21, -0.07, and -0.04. The results implied that better socio-economic conditions in the studied regions and the neighboring areas contributed to a reduction in road accidents including injuries. This was attributed to a higher level of responsibility and self-awareness among citizens in more developed regions.
Autocorrelation; Road crashes; Spatial effects; Spatial lag; Spatial regression model
Road safety is part of the key responsibilities of governments across the world (Mustakim et al., 2023; Siregar et al., 2022). Most countries set clear objectives to reduce the number of road accidents. For instance, the Agenda 2030 for Sustainable Development aims to reduce deaths and injuries from road traffic accidents by 50% (WHO, 2018). Road traffic accidents have a significant impact on the socio-economic well-being of society. These accidents lead to the loss of human lives, physical and psychological injuries, as well as enormous economic costs (Albalate and Fageda, 2021; Sánchez-González et al., 2021).
Research in the modeling and analysis of the socio-economic consequences of road accidents holds both cognitive and practical importance. It helps not only to understand the scale of the problem but also to develop effective strategies and measures to prevent accidents, reduce risks, and minimize the negative impact on society and the economy (Castillo-Manzano et al., 2024; Haghani et al., 2022; Myhrmann et al., 2021; Su et al., 2021; Benito et al., 2021; Elvik et al., 2019; Liu et al., 2019).
Previous publications analyzing road crashes in specific Russian regions showed that a general analysis of crash origin factors was not effective for accurately predicting accidents (Muratova et al., 2024; Rodionova et al., 2024; Skhvediani et al., 2023; Rodionova et al., 2021). Therefore, it is important to incorporate more specific variables to improve the predictive power of the models. For example, transport planning often begins with identifying high-risk zones or black spots (Castillo-Manzano et al., 2024; Shi et al., 2024; Yu et al., 2014; Montella, 2010). This suggests that the spatial concentration of road crashes is a crucial factor in analysing the transportation system. Several authors also investigate the spatiotemporal patterns of road crash concentrations. For example, Soltani and Askari examined the localisation and hotspot distribution of road crashes in Iran and identified clusters using Moran’s I and the Getis-Ord Gi* index (Soltani and Askari, 2017). Many other scholars use Moran’s I to detect spatial autocorrelation and then analyse the distribution of road crashes using spatial regression models (Sipos et al., 2021; Ziakopoulos and Yannis, 2020; Ver Hoef et al., 2018; Rhee et al., 2016).
The current research aims to investigate the territorial distribution of severe and fatal road accidents across 83 Russian regions during the period from 2015 to 2021. It further examines whether variations in the economic and social development across these regions influence the frequency of severe or fatal road crashes. The central hypothesis is that the level of regional socio-economic development affects the number of injury-related accidents, considering both spatial and temporal effects. Therefore, this research estimates the direct and indirect effects of regional development on road accident numbers and analyses the presence of spatial spillover effects.
The research is structured where the next section outlines the algorithm and describes the analytical methods used. It also explains the data collection process and presents a dataset along with a preliminary analysis. The third section presents and discusses the results, comparing with previous articles. Finally, the analysis concludes with reflections on the implications for improving future road crash analysis and offers recommendations for further research.
According to the literature, the most effective algorithms for spatial analysis were the combination of Moran’s I and spatial regression modelling. Many research have presented this method by estimating Moran’s I and applying spatial regression models to detect spatial spillover effects and clusters (Skhvediani and Sosnovskikh, 2020; Lee et al., 2018; Cai et al., 2016; Narayanamoorthy et al., 2013). Therefore, the research adopted the algorithm as presented in Figure 1.
Stage 1 of this research included data curation. During this stage, the analysis collected the appropriate dataset, filled in missing data, conducted a correlation analysis on the initial data, and transformed the data for further analysis.
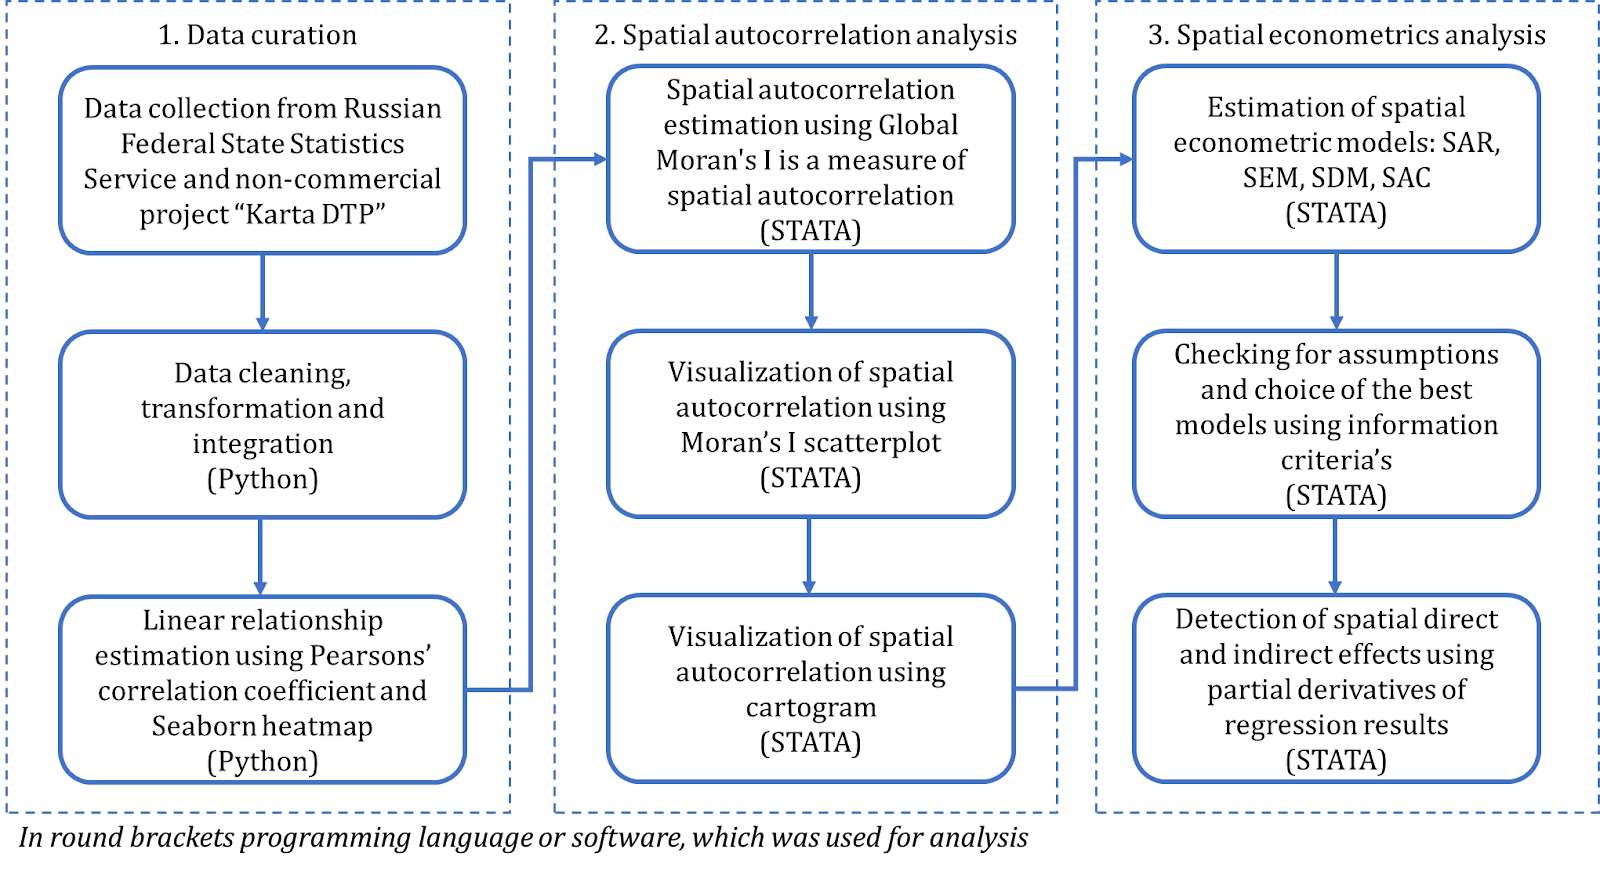
Figure 1 Spatial Analysis Algorithm
In particular, the dataset for the analysis was collected from three databases namely Karta DTP, ROSSTAT, and EMISS (Karta DTP, 2024; ROSSTAT, 2024; EMISS, 2024). Karta DTP was used for the collection of data on the number of road crashes in Russian regions. The Russian Federal State Statistics Service (ROSSTAT) and Unified Interdepartmental Statistical Information System (EMISS) provided data on regional socio–economic development. The analysis further gathered data for 83 out of 89 Russian regions from 2015 to 2021 due to limited data availability for certain indicators. To account for differences in population size, the number of road crashes with injuries was scaled per 100,000 people. The list of dependent, independent, and control variables is presented in Table 1.
Table 1 Description of variables
Correlation analysis of initial data was conducted using Pearson’s correlation coefficient and visualized using Seaborn heatmap in Python. Stage 2 focused on the spatial autocorrelation analysis of the dependent variable. The analysis was conducted using Global Moran’s I as shown in Equation 1.

where wij is the element of the contiguity-based weight matrix W,
xi is the studied indicator of region i,
xj is the studied indicator of region j,
n is the total number of regions.
The identification of spatial heterogeneity across the entire data set was carried out using the Global Moran’s I (Anselin, 2003), which provided a statistic to reflect spatial autocorrelation for the whole sample. Evaluation of the statistical significance of spatial autocorrelation related to the following hypotheses.
H0: spatial autocorrelation is zero (random);
H1: spatial autocorrelation is not zero (spatial patterns are present).
Additionally, the research visualized the results using Moran’s scatterplot and cartogram of Russian regions. Moran’s scatterplot indicated the relationship between the number of road crashes in each region and the average value of the same attribute at neighboring locations. The y-axis of this scatter plot reflected average values of the examined variable in neighboring regions, while the x-axis represented the same variable in the region under analysis. These values were usually standardized and the scatterplot was divided into four quadrants, namely:
High-high quadrant (upper-right) contained observations, whose values and spatial lag values were higher than the mean.
High-low quadrant (lower right) contained observations, whose values were higher than the mean, but the spatial lag values were lower than the mean.
Low-low quadrant (lower left) contained observations, whose values and spatial lag values were lower than the mean.
Low-high quadrant (upper left) contained observations, whose values were lower than the mean, but the spatial lag values were higher than the mean.
When most of the observations were in the high–high and low–low quadrants, positive spatial autocorrelation was indicated, suggesting that neighboring regions were similar. Conversely, when most were in low–high or high–low, negative spatial autocorrelation was present, indicating dissimilarity among neighboring regions.
Additionally, we visualize results using cartogram of explored Russian regions. It contains data on the type of Moran’s I quadrant to which certain region belongs. Therefore, we visually demonstrate patterns of regional distribution depending on explored variable.
Additionally, the research presented a cartogram that showed the type of Moran’s I quadrant to which each region belonged. This visualization helped to identify and demonstrate spatial patterns of road crash distribution across the regions. When spatial autocorrelation was found to be non-zero, then spatial patterns were deemed present in the data (Elhorst, 2014). Therefore, the next stage of the research included spatial econometric modelling. These models incorporated spatial lags of variables—i.e., weighted averages from neighboring units—using spatial matrices. Typically, it was assumed that the influence of neighbors reduced with distance (Herrera-Gomez, 2022; Khattak et al., 2021; Belotti et al., 2017). The spatial models applied in this research were presented in Table 2.
Table 2 Specification of Spatial Econometric Models

Table 2 provided formulas of spatial models as used for the research, where Yt represented a one-dimensional matrix of a dependent variable (y was provided in Table 1);

Moreover, the models were analyzed with both random and fixed effects. Besides, three independent variables including GRP, AP_person, and Innov were incorporated into the natural logarithm. To select the best model for the current research, Akaike and Bayesian information criteria were adopted. The model with the lowest criteria values was considered the best fit.
The research used the selected model to examine the presence of spatial spillover effects, to determine whether neighboring regions had any influence on a given region. These effects were assessed by calculating direct and indirect effects using the partial derivatives method, as described by Elhorst (Elhorst, 2014).
3.1. Estimation of Correlation and Spatial Autocorrelation of the Dependent Variable
The dataset was initially analysed using Pearson’s correlation as shown in Figure 2.
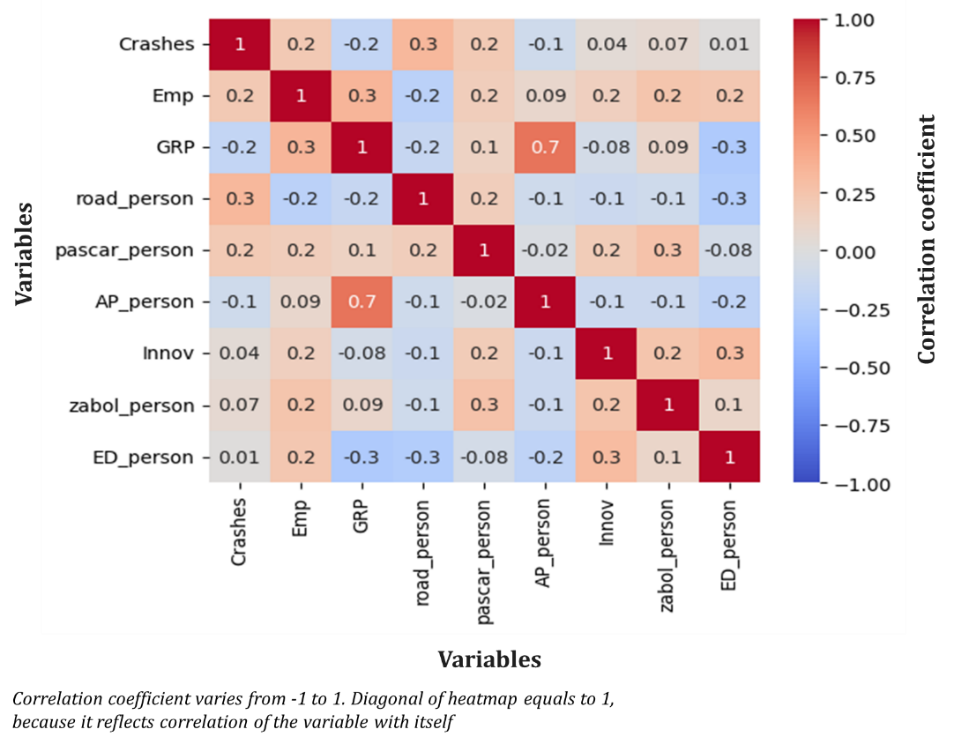
Figure 2 Correlation heatmap of the regional indicators
The correlation coefficient between the number of road crashes with injuries per 100,000 people and the independent variables fell within the interval (-0.2, 0.3), indicating weak or no high linear relationships. This supported the application of natural logarithms to certain variables in meeting the linearity assumption. Additionally, this suggested the potential presence of indirect (spatial spillover) effects.
Spatial autocorrelation was estimated to determine whether a clustering pattern of road crashes existed. For this, the global Moran’s I was computed across six years, and the results were presented in Table 3. Moran’s I results showed positive and statistically significant spatial autocorrelation at the 5% level in each year examined. This indicated that neighboring regions in the Russian Federation generally recorded similar numbers of road crashes with injuries per 100,000 people—evidence of spatial clustering. However, over the period under review, the Global Moran’s I statistic declined, suggesting a shift in the spatial distribution pattern of road crashes across regions.
Table 3 Moran’s I for the Number of Road Crashes with Injuries per 100,000 People by observed years
Figures 3 and 4 presented Moran scatterplots that showed a positive relationship between the average number of road crashes with injuries per 100,000 people in both neighboring and target regions in 2015 and 2021. This was due to the presence of positive spatial autocorrelation—regions with similar road crash values were generally located close to one another.
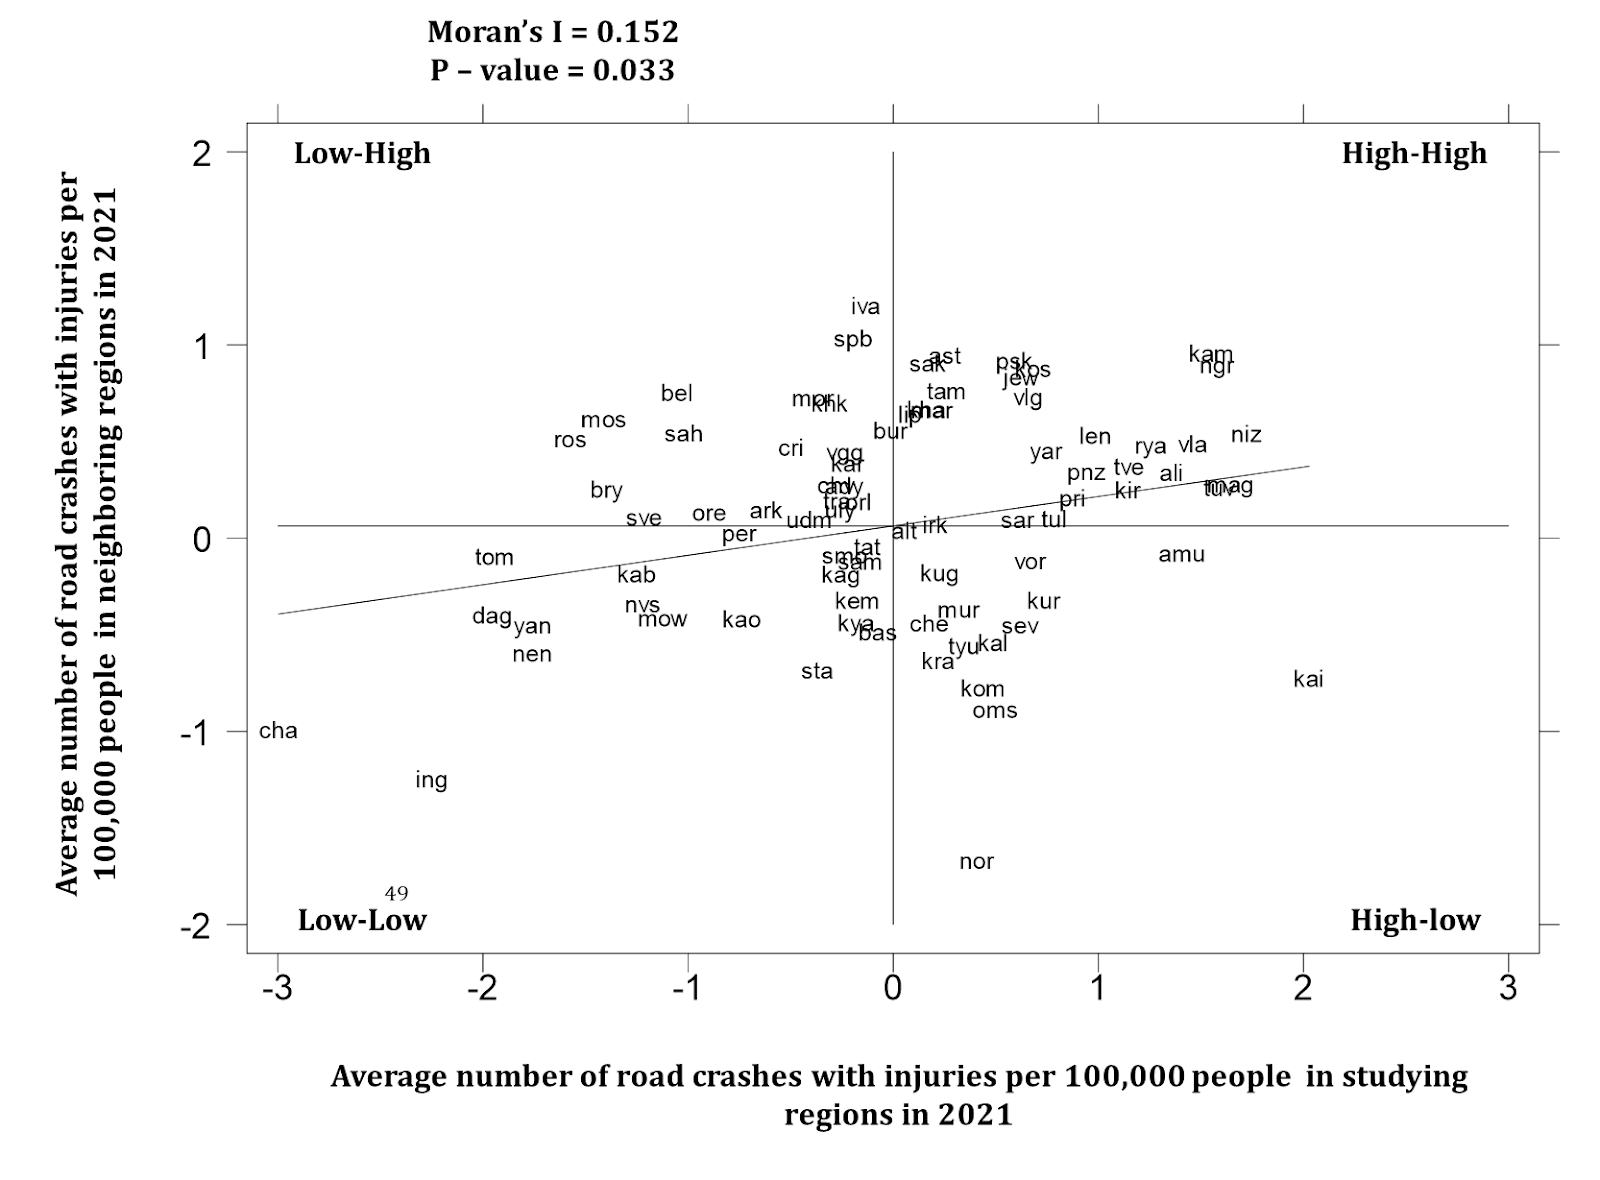
Figure 3 Moran’s I of Road Crashes by Regions in 2015
Figure 4 Moran’s I of Road Crashes by Regions in 2021
Over time, more regions shifted from the High–High and Low–Low quadrants to the High–Low and Low–High quadrants. This indicated a weakening of the spatial autocorrelation pattern across the Russian regions examined. In 2015, the distribution of the dependent variable was more tightly clustered, implying that high values were surrounded by high values, and low values by low values. Similar results were reported by Sipos et al. (2021), Casado-Sanz et al. (2020), Ryder et al. (2019), Soltani and Askari (2017), and Cantillo et al. (2016). Additionally, as regions became more dispersed across quadrants, regional heterogeneity regarding the studied parameter increased. This correlated with the findings of Gomes et al. (2017) and Barua et al. (2016). Figure 5 displayed a cartogram that indicated the geographical distribution of regions and the respective Moran scatterplot quadrants in 2021.
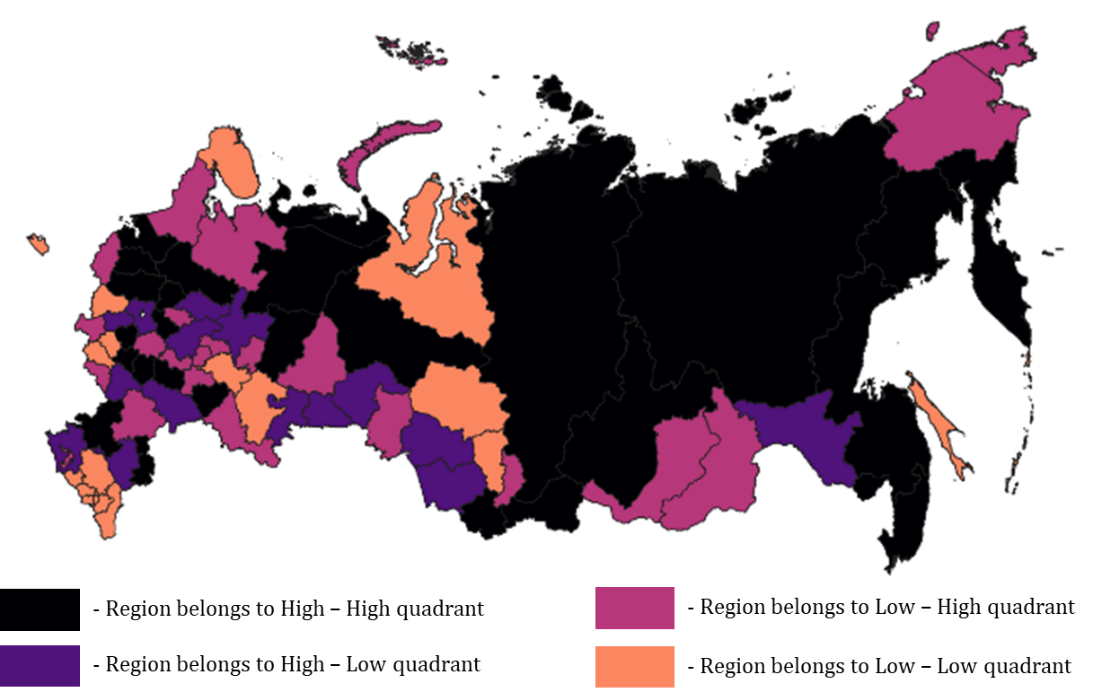
Figure 5 Moran’s I of road crashes by Russian regions in 2021
Coral and black quadrants corresponded to the Low–Low and High–High quadrants. These regions were clustered by high and low values of road crashes with injuries per 100,000 people, respectively.
3.2. Regression Analysis of Road Crashes with Injuries
Spatial regression models were used to analyze the impact of economic factors on the number of road crashes with injuries per 100,000 people. Furthermore, Moran’s I previously indicated the presence of spatial concentration patterns as observed in the results presented in Table 4.
Table 4 Results of the Regression Modelling
The best-performing models were the fixed-effects models, particularly the Spatial Autoregressive Combined model (SAC-FE), which had the lowest information criteria values. This indicated that the model incorporating the spatial lag of the dependent variable, spatial error lag, and fixed effects had the highest explanatory power. Direct and indirect effects of the selected variables on crash numbers are shown in Table 5.
Variables such as Gross Regional Product (GRP), number of roads per person, number of buses per person, and innovative activity showed statistical significance, with p-values below 0.01. Indirect effects exceeded direct ones, confirming the presence of spatial spillover effects. This indicated that neighboring regions contributed more to the crash rates in the studied regions. Specifically, regions bordered by larger or more developed regions recorded fewer crashes. Most significant variables exhibited inverse relationships—higher GRP, more roads per person, and greater innovation levels were associated with lower crash rates. Conversely, an increase in the number of buses per person corresponded with an increase in road crashes with injuries, demonstrating a positive coefficient of determination. Similar findings were documented by Sipos et al. (2021) and Rhee et al. (2016).
Table 5 Effects of Independent Variables on Road Crashes Obtained from the SAC Model with Fixed Effects
These variables as GRP, the number of roads per person, the number of buses per person, and innovative activity were significant, as the p-values were less than 0.01. Moreover, indirect effects were higher than direct effects, indicating the presence of spatial spillover effects. In absolute terms, this suggested that neighboring regions contributed more to the number of accidents in the regions examined. In particular, when a specific region was surrounded by larger or more developed regions, the number of accidents there tended to be lower. Most of the significant variables demonstrated an inverse relationship (GRP, number of roads per person, and innovative activity), indicating that higher regional economic indicators were associated with fewer road crashes involving injuries. Conversely, the number of buses per person exhibited a direct relationship, showing that a higher number of buses per person correlated with a lower number of road crashes, as reflected by the positive coefficient of determination. Similar findings were presented by authors such as Sipos, Rhee, Kim, Lee, and Ulfarsson (Sipos et al., 2021; Rhee et al., 2016).
The results obtained could serve as a basis for adjusting investment policies aimed at developing road transport infrastructure in neighboring regions. For instance, the development of the road transport network in the Leningrad region, along with its economic advancement, was important for St. Petersburg. With improvements in the economic indicators of the Leningrad region and increased investment in road infrastructure, the number of accidents with injuries in St. Petersburg was expected to decline due to the spatial spillover effect. Therefore, when formulating investment policies for developing the road transport network in St. Petersburg, it was essential to consider collaborative efforts with the neighboring Leningrad region.
In conclusion, road traffic accidents including injuries that occurred on the Russian Federation roads from 2015 to 2021 were analyzed in relation to the economic indicators of neighboring regions. Firstly, the presence of a spatial relationship between the road crashes across Russian regions was confirmed. Secondly, the research showed the optimal performance of spatial models compared to traditional OLS models. Thirdly, GRP, the number of roads per person, the number of buses per person, and innovative activity were identified as significant factors contributing to the occurrence of road accidents. Fourthly, the contribution of neighboring regions to the number of accidents in the examined region which indicated the presence of spatial spillover effects was also confirmed. The main limitation of the research was that the obtained model did not account for behavioral factors related to participants in the road transport network. This aspect could be explored in future research.
This research was funded by the Russian Science Foundation (project No. 23-78-10176, https://rscf.ru/en/project/23-78-10176/).
Albalate, D & Fageda, X 2021, 'On the relationship between congestion and road safety in cities', Transport Policy, vol. 105, pp. 145-152, https://doi.org/10.1016/j.tranpol.2021.03.011
Anselin, L 2003, 'Spatial externalities, spatial multipliers, and spatial econometrics', International Regional Science Review, vol. 26, no. 2, pp. 153-166, https://doi.org/10.1177/0160017602250972
Barua, S, El-Basyouny, K & Islam, MT 2016, 'Multivariate random parameters collision count data models with spatial heterogeneity', Analytic Methods in Accident Research, vol. 9, pp. 1-15, https://doi.org/10.1016/j.amar.2015.11.002
Belotti, F, Hughes, G & Mortari, AP 2017, 'Spatial panel-data models using Stata', The Stata Journal, vol. 17, no. 1, pp. 139–180, https://doi.org/10.1177/1536867X1701700109
Benito, B, Martínez-Córdoba, P-J & Guillamón, M-D 2021, 'Measurement and determinants of efficiency in the municipal police service', Evaluation and Program Planning, vol. 85, article 101904, https://doi.org/10.1016/j.evalprogplan.2020.101904
Cai, Q, Lee, J, Eluru, N & Abdel-Aty, M 2016, 'Macro-level pedestrian and bicycle crash analysis: Incorporating spatial spillover effects in dual state count models', Accident Analysis & Prevention, vol. 93, pp. 14–22, https://doi.org/10.1016/j.aap.2016.04.018
Cantillo, V, Garcés, P & Márquez, L 2016, 'Factors influencing the occurrence of traffic accidents in urban roads: A combined GIS-Empirical Bayesian approach', DYNA, vol. 83, pp. 21–28. https://doi.org/10.15446/dyna.v83n195.47229
Casado-Sanz, N, Guirao, B & Attard, M 2020, 'Analysis of the risk factors affecting the severity of traffic accidents on Spanish crosstown roads: The driver's perspective', Sustainability, vol. 12, article 2237. https://doi.org/10.3390/su12062237
Castillo-Manzano, JI, Castro-Nuño, M & Lopez-Valpuesta, L 2024, 'Planning traffic surveillance in Spain: How to optimize the management of police resources to reduce road fatalities', Evaluation and Program Planning, vol. 102, article 102379. https://doi.org/10.1016/j.evalprogplan.2023.102379
Elhorst, JP 2014, Spatial econometrics: From cross-sectional data to spatial panels, Springer, https://doi.org/10.1007/978-3-642-40340-8
Elvik, R, Sagberg, F & Langeland, PA 2019, 'An analysis of factors influencing accidents on road bridges in Norway', Accident Analysis & Prevention, vol. 129, pp. 1–6, https://doi.org/10.1016/j.aap.2019.05.002
EMISS 2024, Federal State Statistics Service of Russia, viewed 9 July 2024, https://www.fedstat.ru/
Gomes, MJTL, Cunto, F & da Silva, AR 2017, 'Geographically weighted negative binomial regression applied to zonal level safety performance models', Accident Analysis & Prevention, vol. 106, pp. 254-261, https://doi.org/10.1016/j.aap.2017.06.011
Haghani, M, Behnood, A, Dixit, V & Oviedo-Trespalacios, O 2022, 'Road safety research in the context of low-and middle-income countries: Macro-scale literature analyses, trends, knowledge gaps and challenges', Safety Science, vol. 146, article 105513, https://doi.org/10.1016/j.ssci.2021.105513
Herrera-Gómez, M 2022, Spatial econometrics with Stata: Exploratory spatial data analysis (ESDA), spatial models for cross-sectional data, spatial models for panel data, Graduate School of International Development Nagoya University (Japan), http://dx.doi.org/10.13140/RG.2.2.24440.93442
Karta DTP 2024, Traffic Accident Statistics of the Russian Federation, viewed 9 April 2024, (https://dtp-stat.ru/)
Khattak, MW, Pirdavani, A, De Winne, P, Brijs, T & De Backer, H 2021, 'Estimation of safety performance functions for urban intersections using various functional forms of the negative binomial regression model and a generalized Poisson regression model', Accident Analysis & Prevention, vol. 151, article 105964, https://doi.org/10.1016/j.aap.2020.105964
Lee, J, Yasmin, S, Eluru, N, Abdel-Aty, M & Cai, Q 2018, 'Analysis of crash proportion by vehicle type at traffic analysis zone level: A mixed fractional split multinomial logit modeling approach with spatial effects', Accident Analysis & Prevention, vol. 111, pp. 12-22, https://doi.org/10.1016/j.aap.2017.11.017
Liu, J, Hainen, A, Li, X, Nie, Q & Nambisan, S 2019, 'Pedestrian injury severity in motor vehicle crashes: An integrated spatio-temporal modeling approach', Accident Analysis & Prevention, vol. 132, article 105272, https://doi.org/10.1016/j.aap.2019.105272
Montella, A 2010, 'A comparative analysis of hotspot identification methods', Accident Analysis & Prevention, vol. 42, pp. 571–581, https://doi.org/10.1016/j.aap.2009.09.025
Muratova, MA, Plotnikov, DG, Talipova, LV, Skhvediani, AE & Banite, AV 2024, 'Assessment of the effect of road infrastructure on traffic accidents based on the fuzzy linear regression method', in Sari, M & Kulachinskaya, A (eds), Digital transformation: What are the smart cities today?, Lecture Notes in Networks and Systems, vol. 846, pp. 221-235, https://doi.org/10.1007/978-3-031-49390-4_16
Mustakim, F, Aziz, AA, Mahmud, A, Jamian, S, Hamzah, NAA & Aziz, NHBA 2023, 'Structural equation modeling of right-turn motorists at unsignalized intersections: Road safety perspectives', International Journal of Technology, vol. 14, no. 6, pp. 1216-1227, https://doi.org/10.14716/ijtech.v14i6.6644
Myhrmann, MS, Janstrup, KH, Møller, M & Mabit, SE 2021, 'Factors influencing the injury severity of single-bicycle crashes', Accident Analysis & Prevention, vol. 149, article 105875, https://doi.org/10.1016/j.aap.2020.105875
Narayanamoorthy, S, Paleti, R & Bhat, CR 2013, 'On accommodating spatial dependence in bicycle and pedestrian injury counts by severity level', Transportation Research Part B: Methodological, vol. 55, pp. 245-264, https://doi.org/10.1016/j.trb.2013.07.004
Rhee, KA, Kim, J-K, Lee, Y-I & Ulfarsson, GF 2016, 'Spatial regression analysis of traffic crashes in Seoul', Accident Analysis & Prevention, vol. 91, pp. 190-199, https://doi.org/10.1016/j.aap.2016.02.023
Rodionova, M, Kudryavtseva, T, & Skhvediani, A 2024, ‘Machine learning algorithms as a tool for improving road safety’, In: Digital Transformation: What are the Smart Cities Today?, Lecture Notes in Networks and Systems, vol 846, Springer, Cham, https://doi.org/10.1007/978-3-031-49390-4_3
Rodionova, M, Skhvediani, A & Kudryavtseva, T 2021, 'Determinants of pedestrian–vehicle crash severity: Case of Saint Petersburg, Russia', International Journal of Technology, vol. 12, no. 7, pp. 1427-1436, https://doi.org/10.14716/ijtech.v12i7.5403
ROSSTAT 2024, Federal State Statistics Service of Russia, viewed 9 July 2024, (https://rosstat.gov.ru/)
Ryder, B, Dahlinger, A, Gahr, B, Zundritsch, P, Wortmann, F & Fleisch, E 2019, 'Spatial prediction of traffic accidents with critical driving events—Insights from a nationwide field study', Transportation Research Part A: Policy and Practice, vol. 124, pp. 611-626, https://doi.org/10.1016/j.tra.2018.05.007
Sánchez-González, MP, Tejada-Ponce, Á, Bonnefoy, J & Escribano-Sotos, F 2021, 'Regional conditions and road traffic collisions on rural roads in Chile', Journal of Transport & Health, vol. 20, article 100996, https://doi.org/10.1016/j.jth.2020.100996
Shi, J, Bai, T, Zhao, Z & Tan, H 2024, 'Driving economic growth through transportation infrastructure: An in-depth spatial econometric analysis', Sustainability, vol. 16, no. 10, article 4283, https://doi.org/10.3390/su16104283
Sipos, T, Afework Mekonnen, A & Szabó, Z 2021, 'Spatial econometric analysis of road traffic crashes', Sustainability, vol. 13, no. 5, article 2492, https://doi.org/10.3390/su13052492
Siregar, ML, Tjahjono, T & Yusuf, N 2022, 'Predicting the segment-based effects of heterogeneous traffic and road geometric features on fatal accidents', International Journal of Technology, vol. 13, no. 1, pp. 92-102, https://doi.org/10.14716/ijtech.v13i1.4450
Skhvediani, A & Sosnovskikh, S 2020, 'What agglomeration externalities impact the development of the hi-tech industry sector? Evidence from the Russian regions', International Journal of Technology, vol. 11, no. 6, pp. 1091-1102, https://doi.org/10.14716/ijtech.v11i6.4423
Skhvediani, A, Rodionova, M, Savchenko, N, Kudryavtseva, T 2023, ‘Prediction of the road accidents severity level: case of saint-petersburg and leningrad oblast’, International Journal of Technology, vol. 14, no. 8, pp. 1717-1727, https://doi.org/10.14716/ijtech.v14i8.6859
Soltani, A & Askari, S 2017, 'Exploring spatial autocorrelation of traffic crashes based on severity', Injury, vol. 48, no. 3, pp. 637-647, https://doi.org/10.1016/j.injury.2017.01.032
Su, J, Sze, NN & Bai, L 2021, 'A joint probability model for pedestrian crashes at macroscopic level: Roles of environment, traffic, and population characteristics', Accident Analysis & Prevention, vol. 150, article 105898, https://doi.org/10.1016/j.aap.2020.105898
Ver Hoef, JM, Peterson, EE, Hooten, MB, Hanks, EM & Fortin, MJ 2018, 'Spatial autoregressive models for statistical inference from ecological data', Ecological Monographs, vol. 88, no. 1, pp. 36-59, https://doi.org/10.1002/ecm.1283
World Health Organization (WHO) 2018, Global status report on road safety 2018, WHO, Geneva, viewed 5 August 2024 (https://www.who.int/publications/i/item/9789241565684)
Yu, H, Liu, P, Chen, J & Wang, H 2014, 'Comparative analysis of the spatial analysis methods for hotspot identification', Accident Analysis & Prevention, vol. 66, pp. 80-88, https://doi.org/10.1016/j.aap.2014.01.017
Ziakopoulos, A & Yannis, G 2020, 'A review of spatial approaches in road safety', Accident Analysis & Prevention, vol. 135, article 105323, https://doi.org/10.1016/j.aap.2019.105323