Developing a Machine Learning Model to Improve the Accuracy of Owner Estimate Cost in the Capital Expenditure Procurement Process
Corresponding email: mustikasarisayuti@gmail.com
Published at : 17 Jul 2025
Volume : IJtech
Vol 16, No 4 (2025)
DOI : https://doi.org/10.14716/ijtech.v16i4.7409
Berawi, MA, Sari, M, Amiri, NYA, Susilowati, SI, Utami, SR & Kulachinskaya, A 2025, ‘Developing a machine learning model to improve the accuracy of owner estimate cost in the capital expenditure procurement process’, International Journal of Technology, vol. 16, no. 4, pp. 1179-1189
| Mohammed Ali Berawi | 1. Department of Civil and Environmental Engineering, Faculty of Engineering, Universitas Indonesia, Kampus UI Depok, Depok 16424, Indonesia. 2. Center for Sustainable Infrastructure Development, Fac |
| Mustika Sari | 1. Department of Civil and Environmental Engineering, Faculty of Engineering, Universitas Indonesia, Kampus UI Depok, Depok 16424, Indonesia. 2. Center for Sustainable Infrastructure Development, Fac |
| Nur Hayati A. Amiri | Center for Sustainable Infrastructure Development, Faculty of Engineering, Universitas Indonesia, Kampus UI Depok, Depok 16424, Indonesia |
| suci indah susilowati | Center for Sustainable Infrastructure Development, Faculty of Engineering, Universitas Indonesia, Kampus UI Depok, Depok 16424, Indonesia |
| Siti Rahma Utami | Center for Sustainable Infrastructure Development, Faculty of Engineering, Universitas Indonesia, Kampus UI Depok, Depok 16424, Indonesia |
| Anastasia Kulachinskaya | Peter the Great St.Petersburg Polytechnic University, Graduate School of Industrial Economics, Polytechnicheskaya, 29, St. Petersburg, 195251, Russia |

Inaccurate Owner Estimate Cost (OEC) calculations often lead to procurement failures in the purchasing process, which is affecting the success of government capital expenditure projects in Indonesia. The OEC serves as a critical benchmark for evaluating bid fairness, and errors in its calculation can cause financial mismanagement as well as regulatory issues. Therefore, this study aimed to improve OEC accuracy by developing a Machine Learning (ML) model based on Linear Regression (LR) algorithm capable of predicting price fluctuations in the procurement of government-owned building projects. Data from a state-owned building construction project and the data from Analysis of Work Unit Prices for 2017-2020 were analyzed as well as used to predict 2021 price amendment for various construction work items in the year. The developed ML model showed strong accuracy, with Root Mean Squared Error (RMSE) values ranging from 0.012 to 0.037 as well as Mean Absolute Error (MAE) values between 0.011 and 0.029 across job descriptions, signifying a strong fit. The results showed the superiority of the developed model over similar studies in terms of precision and interpretability, offering a solution to improve procurement decision-making.
Capital expenditure procurement; Machine learning; Owner estimate cost
Capital expenditure is an important category in public sector institutions, which handles acquiring fixed assets, such as land, buildings, buildings, and equipment (Sutopo and Siddi, 2018). Due to this reason, capital expenditure procurement is an important measure of performance and a major driver of economic growth, especially in infrastructure as well as development projects. Both central and local governments aim to maximize revenue to fund these expenditures, which are essential for building basic infrastructure, improving public services, as well as supporting national development (Mukmin et al., 2020).
The implementation of capital expenditure in Indonesia has often faced setbacks due to a high rate of procurement failures. These failures are caused by several factors, including non-compliance with regulations, lack of experience among estimators, pricing survey errors, weak banking support, and inaccurate Owner Estimate Cost (OEC) calculations (Bosio et al., 2023; Strang, 2021; Mokeeva and Yurko, 2023). OEC refers to the estimated total cost of a project or service, covering all components from the initial design to final delivery (Koo et al., 2010). In government procurement, the OEC also includes Value-Added Tax (VAT) after the technical specifications in the Terms of Reference (TOR) are finalized. Inaccurate OEC can pose serious risks during procurement, potentially leading to financial losses and legal issues. OEC should be prepared using a transparent, accountable method based on current and reliable data to minimize these risks. Conducting a thorough market analysis before selecting suppliers is also essential to prevent procurement failures (Safa et al., 2014).
During the tendering phase, OEC acts as a benchmark for determining fair prices based on market conditions. When the OEC is set too low, it may discourage competitive bidding, which can cause project delays or even failures. Consequently, when the OEC is too high, it can lead to government overspending, potentially activating public criticism and concerns over financial mismanagement (Astana et al., 2023).
Inaccurate OEC increase the risk of disputes between contractors and clients. Large gaps between the OEC and the final bid can cause financial strain for contractors, which may lead to project delays as well as lower quality outcomes (Oo et al., 2022; Mohamed et al., 2011). In construction projects, contract changes often happen due to factors such as changes in project scope, schedule, or costs (Khoso et al., 2019). These changes are commonly referred to as Addendums, Contract Change Orders (CCOs), and Variation Orders (VOs). Addendums are extra documents added to the original contract, with agreement of both parties, to include any missing details or unclear requirements. Additionally, CCOs include changes in the amount of work or project timeline, without altering the main terms of the contract. VOs refer to changes in scope, technical specifications, costs, or applicable regulations (Mohammad et al., 2017).
Since procurement consists of a large share of national capital expenditures, inaccurate OEC can directly impact the timely and cost-effective completion of infrastructure projects, affecting total government performance (Komakech, 2016). A significant gap between the OEC and the winning bid poses a major risk during the pre-tendering phase, potentially causing project cancellations, reduced scope, or delays in the schedule (Almohsen et al., 2023). Factors such as economic instability, errors in pricing surveys, and limited experience among estimators can further widen these gaps (Liu and Zhu, 2023).
Machine Learning (ML), a branch of Artificial Intelligence (AI), can improve the accuracy of OEC and help reduce the risks associated with procurement failures. By analyzing large datasets, ML algorithms can identify patterns and generate more accurate predictions to support better decision-making (Ma’ruf et al., 2024; Sari et al., 2023; Berawi et al., 2019). In addition, ML provides a more flexible and data-driven procedure compared to traditional cost estimation methods, which often depend on simple statistical processes and may not consider market volatility or complex cost structures (Hashemi et al., 2020; Budiono et al., 2014; Creedy et al., 2010).
The use of ML to predict OEC in the pre-tender phase of construction projects has been explored in several studies. For instance, Li et al. (2022) improved OEC accuracy by applying a feedforward neural network (FFNN) in Friedman’s model to more precisely predict the lowest submitted bid. Similarly, Almohsen et al. (2023) developed a hybrid model combining Artificial Neural Networks (ANN), Deep Neural Networks (DNN), and Time Series (TS) methods to estimate the ratio between the lowest bid as well as the OEC across different contract types and sizes. Additionally, Alsugair et al. (2023) used an ANN model to predict Final Contract Costs (FCC) based on initial OEC values, using Linear Regression (LR) for data processing, a square root function for data transformation, and the logarithmic method of Zavadskas and Turskis for data standardization.
These studies show the potential of ML to improve OEC accuracy and point to important challenges. Neural network (NN)-based models often lack transparency, making it difficult for stakeholders to understand the factors driving cost estimates (Ribeiro et al., 2016). This lack of interpretability limits the practical use of the models, especially in public-sector procurement, where transparency is essential. To address the issue, this study uses a ML model based on LR. Different from NNs, LR provides clear insights into the relationships between historical price adjustments as independent variables and the OEC as the dependent variable.
This study aimed to improve the accuracy of OEC predictions in capital expenditure procurement through the development of an ML model. A systematic method was adopted to achieve this objective, combining theoretical understanding with practical implementation. The theoretical foundation of the study was grounded in data-driven decision-making theory that showed the use of historical data and statistical modeling to improve predictive accuracy (Montgomery et al., 2012). The Cross Industry Standard Process for Data Mining (CRISP-DM) framework was adopted to operationalize this approach. The framework comprised six iterative phases, namely business understanding, data understanding, data preparation, modeling, evaluation, and deployment (Mandolini et al., 2024; Schröer et al., 2021).
In the business understanding phase, the study identified the need to improve the OEC accuracy in capital expenditure projects. During the data understanding phase, procurement contract data was derived from a state-owned building construction project, referred to as the SM project. This data was obtained from a Jakarta-based construction company and included historical records of amended items, price addendums, work volumes, and Work Unit Prices.
The historical price data used spanned from 2017 to 2020, which was selected for its completeness and position with the initial contracts and price adjustments of SM project, further ensuring the consistent patterns for cost estimation. Economic disruptions from 2020 onwards, such as the COVID-19 pandemic, were excluded to maintain dataset consistency. Moreover, Exploratory Data Analysis (EDA) was conducted to verify the absence of missing values and to examine relationships between variables.
During the data preparation phase, the data was processed and transformed into a structured format for ML modeling. Work Unit Prices were categorized into independent (YEAR) and dependent (WORK ITEM PRICE) variables. For OEC calculation, the study used information on amended items in the SM project, including work volumes and Work Unit Prices. These were analyzed using coefficients from the Unit Price Analysis and Basic Unit Prices for labor, materials, as well as equipment sourced from historical data published in the Journal of Unit Prices for Building Materials. The analysis was critical to understanding the standards, specifications, and material costs associated with tasks that experienced price adjustments, providing a detailed basis for model development.
A unit price analysis model, developed according to Indonesian Ministry of Public Works and Housing Regulation No. 28, 2016, was incorporated into a database of calculated unit prices for construction works experiencing price addendums. This database formed the basis for identifying attributes to be used in the ML model development.
Several assumptions were made to ensure the reliability of the model. The assumptions included (1) the representation of pricing trends reflected cost adjustment factors in construction projects, (2) the dataset contained no missing values verified through EDA, as well as (3) pricing trends were linear and followed consistent patterns over the years analyzed.
The modeling phase included developing an LR-based ML, which was implemented in Python-3 in the Jupyter Notebook environment. The LR algorithm was selected for its ability to predict continuous variables based on historical data and the simplicity of interpreting relationships between independent as well as dependent variables. Following the process, the model was trained using an 80:20 split of the dataset as the model learned from existing patterns while testing its accuracy on unseen data (Sari et al., 2022). Predictions for the year 2021 were conducted using the trained model, analyzing pricing trends across various work items.
The accuracy of the model was assessed in the evaluation phase using two metrics, namely Root Mean Square Error (RMSE) and Mean Absolute Error (MAE). These metrics were valuable because the models showed errors in the units of the constituent of interest, which aided in the analysis of results (Hodson, 2022). RMSE was a widely recognized metric for evaluating regression models. It represented square root of the mean of the squared differences between predicted and observed values across all data points (Chicco et al., 2021; Oke et al., 2020). Mathematically, the explanation was represented with the following formula,

where:
yi = observed value
 = predicted value
i = index of the data in the database
n = total number of data points
MAE was determined by computing the absolute errors between each predicted and the actual value, then finding the mean by evaluating the entire dataset. This was performed by subtracting the mean value from each data point, summing the results, then dividing by the total number of datasets. The formula for MAE was represented as follows:

where:
xi = the actual value
x = the predicted value
n = the total number of values
During the analysis, RMSE and MAE values of 0 showed a perfect fit (Moriasi et al., 2007). The values less than half the standard deviation of the measured data were deemed modest, and both metrics were suitable for model evaluation. RMSE showed larger errors because of the squaring of residuals, while MAE offered a direct mean error metric.
Despite this study not including full-scale implementation of the deployment phase, a structured and transparent methodology for developing and validating the ML model was obtained by adopting CRISP-DM framework. Figure 1 showed the study workflow relating to the process during the study.
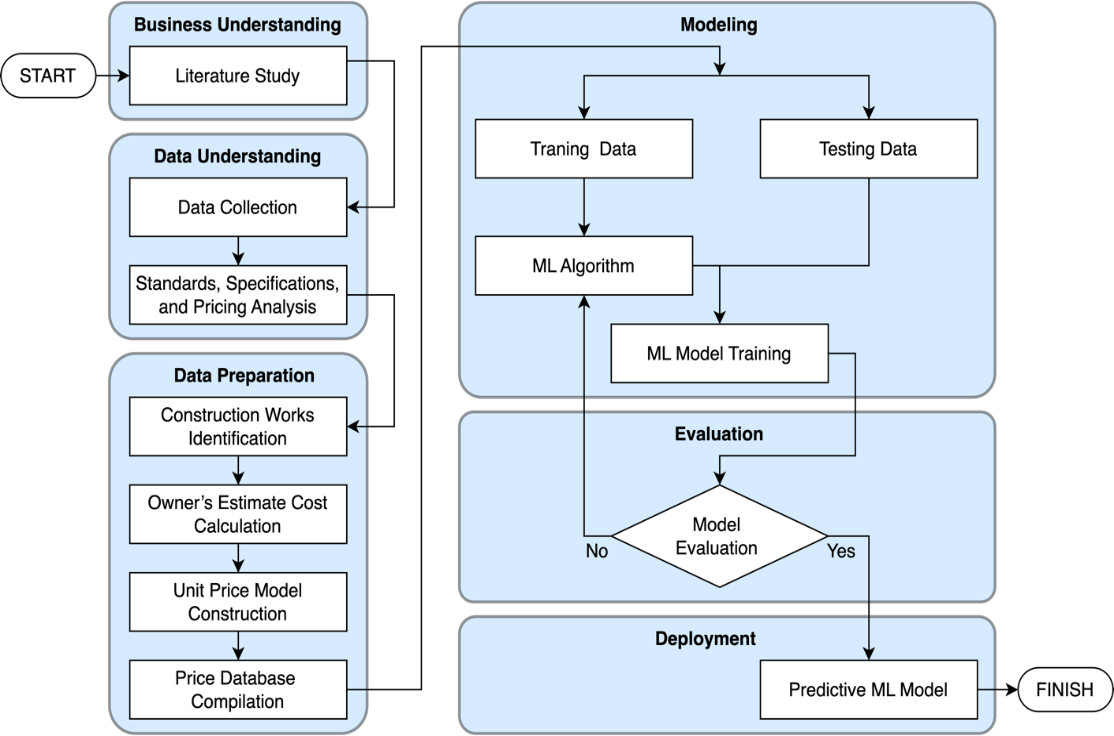
Figure 1 Study Workflow within CRISP-DM framework.
3.1. Identifying the Variables for the ML Model Development
Data from the procurement contract of the SM project that was originally established in 2020 contained works whose prices were adjusted with an addendum in 2021. The contract data included both the original values of OEC and the price revisions that were later affected in one place. Table 1 showed in detail the adjustments included, especially in architectural works. A total of six work items, which had passed through price changes from the initial contract in 2020 to the 2021 addendum were selected for further analysis. Moreover, the analysis was required to develop the ML model that predicted future pricing trends. The adjustments were necessary because the original OEC did not take on post-award signing price increase.
The items included in the sub-items of the six work items shown in Table 1 consisted of a number that required detailed scrutiny. Each sub-item concerning specific contracts with third-party contractors for construction procurement and included confidential information about pricing as well as contractual terms. Having data on the work volumes and unit prices was crucial to accurately calculate the OEC for each sub-item. After identifying the work items that experienced price adjustments through addendums, 16 Work Unit Price items were extracted for further analysis using the coefficients from the Analysis of Work Unit Prices from 2017 to 2020. These datasets were run 10 times for each Work Unit Price item, leading to a total of 64 data points. The data was processed 640 times in the ML model to ensure robustness, providing sufficient volume and variability for effective training of the model.
Table 1 Initial OEC and Price Addendums in SM Project.
The trend formed a background understanding of price changes throughout time and helped predict near-future cost trends more effectively, as shown in Table 2. Table 2 showed the Analysis of Work Unit Prices for 2017-2020 was used to classify work items. This classification selected the YEAR variable as the input variable (x). At the same time, the price of each work item was set as the dependent response variable (y), labeled from WORK1 to WORK16. An LR-based ML model was used to predict future price trends for these work items.
3.2. Developing ML Model
The ML model was developed using Python-3 in the web-based Jupyter Notebook application, the first step of which was importing several libraries. Pandas were used for data manipulation and structuring, Matplotlib was applied for visualization as well as mathematical functions. Additionally, Scikit-learn was used to implement the ML model, specifically the LR model applied in this study.
The data was loaded in two major columns that served as the variables in the ML development process. The first column, labeled "YEAR," was designated as the independent variable (x), while the second column, "WORK," was the dependent variable (y). After the data was loaded, the system showed the data count, types, and memory allocation to ensure accuracy and consistency before continuing to the next step.
After the previous processes, the missing values were then checked during the analysis. There were no missing values when the result was zero (0), signifying the analysis could continue without data imputation. The process was then followed by EDA, which started with a bivariate analysis of the relationship between the YEAR and WORK variables using a scatter plot. This plot helped visualize the relationship between these two factors before proceeding with the modeling process. The correlation was also calculated, which came out to a coefficient of 0.7, signifying a strong positive relationship between YEAR and WORK. The result showed that as the YEAR variable changed, the WORK variable significantly affected it.
The core ML modeling process began after all the previous steps were conducted. The process included establishing the X and Y variables, splitting the data into training and testing sets using an 80:20 ratio, as well as applying the LR algorithm to train the model. During this phase, the model learned from the input data and identified the correct slope and coefficients to make accurate predictions. Finally, the model was run through several iterations to modify and optimize the prediction results. This process ensured that the predictions of the model were reliable and could improve the accuracy of OEC estimation in building construction projects.
Table 2 16 price-adjusted work items and the Analysis of Work Unit Price (2017-2020).
3.3. Evaluating the Accuracy of the ML Model Predictions
The developed ML model generated the optimal prediction results through a repetitive process using variance, where it used slightly different training and testing data sets each time the algorithm ran in a process. Variance referred to the sensitivity of an algorithm to the specific data used during training. The feature showed different results when there were small changes in the data and how the model was trained (Raste et al., 2022).
Several ML algorithms that were not deterministic were stochastic, implying that the behavior of the algorithm was influenced by randomness while it was being trained (Barmpalias et al., 2017). Consequently, being stochastic did not necessarily signify that the model was completely random. Stochastic ML algorithms still learned from the given historical data, but small decisions made during the learning process varied randomly from one iteration to another. As a result, each time a stochastic ML algorithm was run on the same data, the model produced varied slightly, leading to different predictions for the test data. The performance of such stochastic models was reviewed as a distribution with an expected mean error or accuracy and a standard deviation that reflected the level of randomness in the prediction results.
The final prediction outcomes provided price estimates for each work item, allowing accurate analysis of future trends. After passing through the processes of data training, data testing, and averaging the distribution of the predictions, the ML model predictions were shown in Table 3.
The percentage increase in OEC prices was analyzed by multiplying the price database and the predicted price results by the building volume of the SM project. The percentage increase in prices between 2020 and 2021 was then calculated. In addition, the percentage price increase was determined for both the predicted data and the actual SM project data for each sub-work item to evaluate as well as compare the accuracy of the ML predictions, as shown in Table 4.
Table 3 Machine Learning Prediction Results with Price Estimates from 2017–2021.
During the analysis, accurate cost estimation was critical for project success (Mokoena et al., 2023). The predicted price increase from 2020 to 2021 was compared with the actual price increase data from the SM project to evaluate the accuracy improvement of OEC calculations for capital expenditure procurement implementation using the ML model. The result of RMSE and MAE evaluations showed that the ML predictions achieved a high level of accuracy and a good fit with the actual data, as shown in Table 5.
Table 4 Comparison of OEC Price Increases Between Actual and Predicted ML Prices
The findings of this study showed that the developed ML model for OEC prediction achieved strong performance, with RMSE values between 0.012 and 0.037 as well as MAE values ranging from 0.015 to 0.029 across several construction job descriptions. Consequently, Zhang et al. (2023) used a combination of extreme gradient boosting (XGBoost) and Bayesian optimization (BO), achieving 0.8690 RMSE as well as 0.4875 MAE. These higher error metrics were possibly due to each focus on conceptual cost estimation for diverse infrastructure projects, which included heterogeneous datasets with greater variability. The LR model developed in this study showed higher precision by focusing on specific procurement datasets with consistent characteristics. Similarly, Sanni-Anibire et al. (2021) used k-Nearest Neighbors (KNN) to model cost estimations for tall buildings, reporting an RMSE of 6.09. The larger error metrics in the study were attributed to the broader scope of tall building projects and the variability in cost structures. Consequently, the LR model used in this analysis benefited from a more specific dataset.
The methodological selections affected the variations as this study used LR for simplicity and interpretability, while other studies relied on more complicated algorithms. Despite these models capturing non-linear relationships more effectively, the outcomes often included reduced interpretability and increased computational requirements.
Table 5 RMSE and MAE Results compared ML prediction accuracy with actual project data
In conclusion, inaccurate OEC in the capital expenditure procurement process caused project delays and financial mismanagement. This study investigated the usage of ML to improve the accuracy of OEC estimates by developing an ML model with the LR algorithm. Despite the dataset used in this study being derived from a specific project, the incorporation of detailed price addendums and historical adjustments ensured that the model captured major cost-driving trends applicable to similar procurement scenarios. The findings showed that the model significantly improved OEC estimation accuracy, as evidenced by low RMSE values, signifying a strong fit between predicted and actual prices. However, this study had some limitations, particularly the reliance on data from 2017 to 2020 that restricted the relevance of the model to current market trends and conditions. Further studies could include more recent data and explore advanced ML methods, such as deep learning models, to improve the precision of OEC predictions in capital expenditure procurement.
The authors would like to thank the Center for Sustainable Infrastructure Development (CSID) at the Universitas Indonesia for the valuable support provided.
Almohsen, AS, Alsanabani, NM, Alsugair, AM & Al-Gahtani, KS 2023, 'Integrated artificial and deep neural networks with time series to predict the ratio of the low bid to owner estimate', Engineering, Construction and Architectural Management, vol. 31, no. 13, pp. 79-101, https://doi.org/10.1108/ECAM-05-2023-0454
Alsugair, AM, Alsanabani, NM & Al-Gahtani, KS 2023, 'Forecasting the final contract cost on the basis of the owner’s cost estimation using an artificial neural network', Buildings, vol. 13, no. 3, article 786, https://doi.org/10.3390/buildings13030786
Astana, INY, Wiryasa, NA & Pinakesty, SAPA 2023, 'The relationship below 80% of the owner estimate price on construction projects to project performance', Journal of Asian Multicultural Study for Economy and Management Study, vol. 4, no. 1, article 39-51, https://doi.org/10.47616/jamrems.v4i1.396
Barmpalias, G, Cenzer, D & Porter, CP 2017, 'Random numbers as probabilities of machine behavior', Theoretical Computer Science, vol. 673, pp. 1-18, https://doi.org/10.1016/j.tcs.2017.02.001
Berawi, MA, Leviakangas, P, Muhammad, F, Sari, M, Gunawan, Yatmo, YA & Suryanegara, M 2019, 'Optimizing search and rescue personnel allocation in disaster emergency response using fuzzy logic', International Journal of Technology, vol. 10, no. 7, pp. 1416-1426, https://doi.org/10.14716/ijtech.v10i7.3709
Bosio, E, Hayman, G & Dubosse, N 2023, 'The investment case for e-government procurement: A cost-benefit analysis', Journal of Benefit-Cost Analysis, vol. 14, no. 1, pp. 81-107, https://doi.org/10.1017/bca.2023.10
Budiono, HDS, Kiswanto, G & Soemardi, TP 2014, 'Method and model development for manufacturing cost estimation during the early design phase related to the complexity of the machining processes', International Journal of Technology, vol. 5, no. 2, pp. 183-192, https://doi.org/10.14716/ijtech.v5i2.402
Chicco, D, Warrens, MJ & Jurman, G 2021, 'The coefficient of determination R-squared is more informative than SMAPE, MAE, MAPE, MSE and RMSE in regression analysis evaluation', PeerJ Computer Science, vol. 7, article e623, https://doi.org/10.7717/PEERJ-CS.623
Creedy, GD, Skitmore, M & Wong, JKW 2010, 'Evaluation of risk factors leading to cost overrun in delivery of highway construction projects', Journal of Construction Engineering and Management, vol. 136, no. 5, https://doi.org/10.1061/(ASCE)CO.1943-7862.0000160
de Myttenaere, A, Golden, B, Le Grand, B & Rossi, F 2016, 'Mean absolute percentage error for regression models', Neurocomputing, vol. 192, pp. 38-48, https://doi.org/10.1016/j.neucom.2015.12.114 (Not Found in The Text)
Hashemi, ST, Ebadati, OM & Kaur, H 2020, 'Cost estimation and prediction in construction projects: a systematic review on machine learning techniques', SN Applied Sciences, vol. 2, no. 10, article 1703, https://doi.org/10.1007/s42452-020-03497-1
Hodson, TO 2022, 'Root-mean-square error (RMSE) or mean absolute error (MAE): when to use them or not', Geoscientific Model Development, vol. 15, no. 14, pp. 5481-5487, https://doi.org/10.5194/gmd-15-5481-2022
Khoso, AR, Khan, JS, Faiz, RU & Akhund, MA 2019, 'Assessment of change orders attributes in preconstruction and construction phase', Civil Engineering Journal, vol. 5, no. 3, pp. 616-623, https://doi.org/10.28991/cej-2019-03091273
Komakech, R 2016, 'Public procurement in developing countries: Objectives, principles and required professional skills', Publicy Policy and Administration Study, vol. 6, no. 8, pp. 20-29
Koo, CW, Hong, TH, Hyun, CT, Park, SH & Seo, JO 2010, 'A study on the development of a cost model based on the owner’s decision making at the early stages of a construction project', International Journal of Strategic Property Management, vol. 14, no. 2, pp. 121-137, https://doi.org/10.3846/ijspm.2010.10
Li, M, Zheng, Q & Ashuri, B 2022, 'Predicting ratio of low bid to owner’s estimate using feedforward neural networks for highway construction', In: Construction Study Congress 2022, pp. 340-350, https://doi.org/10.1061/9780784483978.036
Liu, M & Zhu, C 2023, 'A real option pricing decision of construction project under group bidding environment', Applied Sciences (Switzerland), vol. 13, no. 2, article 1130, https://doi.org/10.3390/app13021130
Ma’ruf, A, Nasution, AAR & Leuveano, RAC 2024, 'Machine learning approach for early assembly design cost estimation: A case from make-to-order manufacturing industry', International Journal of Technology, vol. 15, no. 4, pp. 1037-1047, https://doi.org/10.14716/ijtech.v15i4.5675
Mandolini, M, Manuguerra, L, Sartini, M, Presti, GML & Pescatori, F 2024, 'A cost modelling methodology based on machine learning for engineered-to-order products', Engineering Applications of Artificial Intelligence, vol. 136A, article 108957, https://doi.org/10.1016/j.engappai.2024.108957
Mohamed, KA, Khoury, SS & Hafez, SM 2011, 'Contractor’s decision for bid profit reduction within opportunistic bidding behavior of claims recovery', International Journal of Project Management, vol. 29, no. 1, pp. 93-107, https://doi.org/10.1016/j.ijproman.2009.12.003
Mohammad, N, Che-Ani, AI & Rakmat, RAOK 2017, 'Causes and effects of variation orders in the construction of terrace housing projects: A case study in the State of Selangor, Malaysia', International Journal of Supply Chain Management, vol. 6, no. 1, pp. 226-232
Mokeeva, T & Yurko, K 2023. 'Using Digital Tools in Government Procurement Analysis: Detecting Suspicious Purchases with Control Indicators', International Journal of Technology, vol. 14, no. 8, pp. 1821-1830, doi:10.14716/ijtech.v14i8.6851
Mokoena, GM, Makhanya, BBS & Nel, H 2023, 'Assessing project cost planning in the construction industry', In: 13th Annual International Conference on Industrial Engineering and Operations Management, pp. 461-472, https://doi.org/10.46254/an13.20230144
Montgomery, DC, Peck, EA & Vining, GG 2012, Introduction to linear regression analysis, John Wiley & Sons
Moriasi, DN, Arnold, JG, Van Liew, MW, Bingner, RL, Harmel, RD & Veith, TL 2007, 'Model evaluation guidelines for systematic quantification of accuracy in watershed simulations', Transactions of the ASABE, vol. 50, no. 3
Mukmin, M, Kusuma, I & Susandra, F 2020, 'The governments capital expenditure: A view from central government and local government in Indonesia', American Based Study Journal, vol. 9, no. 10, pp. 18-23
Oke, EO, Adeyi, O, Okolo, BI, Adeyi, JA, Ayanyemi, J, Osoh, KA & Adegoke, TS 2020, 'Phenolic compound extraction from Nigerian Azadirachta Indica leaves: Response surface and neuro-fuzzy modelling performance evaluation with Cuckoo Search multi-objective optimization', Results in Engineering, vol. 8, article 100160, https://doi.org/10.1016/j.rineng.2020.100160
Oo, BL, Lim, THB & Runeson, G 2022, 'Critical factors affecting contractors’ decision to bid: A global perspective', Buildings, vol. 12, no. 3, article 379, https://doi.org/10.3390/buildings12030379
Raste, S, Singh, R, Vaughan, J & Nair, VN 2022, 'Quantifying inherent randomness in machine learning algorithms', SSRN Electronic Journal, pp. 1-14, https://doi.org/10.2139/ssrn.4146989
Ribeiro, MT, Singh, S & Guestrin, C 2016, '“Why should I trust you?” Explaining the predictions of any classifier', In: Proceedings of the ACM SIGKDD International Conference on Knowledge Discovery and Data Mining, pp. 1135-1144, https://doi.org/10.1145/2939672.2939778
Safa, M, Shahi, A, Haas, CT & Hipel, KW 2014, 'Supplier selection process in an integrated construction materials management model', Automation in Construction, vol. 48, pp. 64-73, https://doi.org/10.1016/j.autcon.2014.08.008
Sanni-Anibire, MO, Mohamad Zin, R & Olatunji, SO 2021, 'Developing a preliminary cost estimation model for tall buildings based on machine learning', International Journal of Management Science and Engineering Management, vol. 16, no. 2, pp. 134-142, https://doi.org/10.1080/17509653.2021.1905568
Sari, M, Berawi, MA, Larasati, SP, Susilowati, SI, Susantono, B & Woodhead, R 2023, 'Developing machine learning model to predict HVAC system of healthy building: A case study in Indonesia', International Journal of Technology, vol. 14, no. 7, pp. 1438-1448, https://doi.org/10.14716/ijtech.v14i7.6682
Sari, M, Berawi, MA, Zagloel, TY, Triadji, RW 2022, 'Machine Learning Model for Green Building Design Prediction.' IAES International Journal of Artificial Intelligence (IJ-AI), vol. 11, no. 4, pp. 1525–34. doi:10.11591/IJAI.V11.I4.PP1525-1534.
Schröer, C, Kruse, F & Gómez, JM 2021, 'A systematic literature review on applying CRISP-DM process model', Procedia Computer Science, vol. 181, pp. 526-534, https://doi.org/10.1016/j.procs.2021.01.199
Strang, KD 2021, 'Which organizational and individual factors predict success vs. failure in procurement projects', International Journal of Information Technology Project Management, vol. 12, no. 3, pp. 1-113, https://doi.org/10.4018/IJITPM.2021070102
Sutopo, B & Siddi, P 2018, 'Capital expenditures and performance of local government administration', Polish Journal of Management Studies, vol. 17, no. 1, pp. 221-231, https://doi.org/10.17512/pjms.2018.17.1.18
Zhang, J, Yuan, J, Mahmoudi, A, Ji, W & Fang, Q 2023, 'A data-driven framework for conceptual cost estimation of infrastructure projects using XGBoost and Bayesian optimization', Journal of Asian Architecture and Building Engineering, vol. 24, no. 2, pp. 751-774, https://doi.org/10.1080/13467581.2023.2294871