Comprehensive Evaluation of Bankruptcy Prediction in Taiwanese Firms Using Multiple Machine Learning Models
Corresponding email: son.daovutruong@rmit.edu.vn
Published at : 31 Jan 2025
Volume : IJtech
Vol 16, No 1 (2025)
DOI : https://doi.org/10.14716/ijtech.v16i1.7227
Pham, HV, Chu, T, Le, TM, Tran, HM, Tran, HTK, Yen, KN & Dao, SVT 2025, 'Comprehensive evaluation of bankruptcy prediction in taiwanese firms using multiple machine learning models', International Journal of Technology, vol. 16, no. 1, pp. 289-309
| Hung V. Pham | School of Science, Engineering and Technology, RMIT University Vietnam, 700000, Ho Chi Minh City, Vietnam |
| Tuan Chu | School of Science, Engineering and Technology, RMIT University Vietnam, 700000, Ho Chi Minh City, Vietnam |
| Tuan M. Le | School of Science, Engineering and Technology, RMIT University Vietnam, 700000, Ho Chi Minh City, Vietnam |
| Hieu M. Tran | School of Science, Engineering and Technology, RMIT University Vietnam, 700000, Ho Chi Minh City, Vietnam |
| Huong T.K. Tran | School of Industrial Engineering and Management, International University, Vietnam National University Ho Chi Minh City, 700000, HCMC, Vietnam |
| Khanh N. Yen | International University, Vietnam National University Ho Chi Minh City, 700000,HCMC, Vietnam |
| Son V. T. Dao | School of Science, Engineering and Technology, RMIT University Vietnam, 700000, Ho Chi Minh City, Vietnam |

Bankruptcy prediction is a significant issue in finance because accurate predictions would enable stakeholders to act quickly to reduce their financial losses. This study developed an advanced bankruptcy prediction model using Support Vector Machines (SVM), Random Forest (RF), and Artificial Neural Network (ANN) algorithms based on datasets from the UCI machine learning repository. The core contribution of this research is the establishment of a hybrid model that effectively combines multiple machine learning (ML) algorithms with advanced data with the Synthetic minority oversampling technique Tomek (SMOTE Tomek) or SMOTE- Edited Nearest Neighbor (SMOTE-ENN) resampling data technique to improve bankruptcy prediction accuracy. Additionally, a wrapper-based feature selection (FS) utilizing Binary Particle Swarm Optimization (BPSO) was utilized to find an optimal feature subset and boost the model’s predictive performance. After selecting the best features, these were used to train the three ML algorithms, and hyper-parameter optimization was implemented to boost model performance. From the results measured by evaluation metrics, the proposed model ANN with the combination of parameter tuning, feature selection algorithm, SMOTE-ENN, and optimal hyper-parameters demonstrates superior performance compared to traditional methods, achieving an F1 Score of 98.5% and an accuracy of 98.6%. The results suggest that the predictive performance of bankruptcy models can be significantly enhanced by integrating multiple analytical methodologies. This approach not only improves the accuracy but also the reliability of financial risk assessments, providing valuable insights for investors, financial analysts, and policymakers. The success of the model opens avenues for further research into hybrid predictive models in various sectors of finance, potentially transforming risk assessment methodologies.
Artificial neural networks; Bankruptcy prediction; Binary particle swarm; Optimization random forest; Synthetic minority oversampling technique (SMOTE)
Bankruptcy prediction has emerged as a critical area of research due to its profound implications for stakeholders, including investors, creditors, and policymakers. The evolution of bankruptcy prediction research spans several decades, with early models like Altman’s Z-score (Prasetiyani and Sofyan, 2020) and Ohlson’s logistic regression (Najib and Cahyaningdyah, 2020) using financial ratios to predict bankruptcy risk effectively. Over the years, the field has transitioned from these simple ratio-based models to more sophisticated multivariate methods, such as logistic regression and discriminant analysis, which have been widely adopted for their enhanced predictive power (Huo et al., 2024). However, the emergence of data-rich environments and complex corporate structures has spurred interest in leveraging advanced ML models. These techniques, including neural networks, Decision Trees (DT), and Support Vector Machines (SVM) (Tobback et al., 2017), have demonstrated superior performance in capturing nonlinear relationships and complex interaction effects among predictors, which are often missed by traditional models.
ML is widely applied in commercial applications and research projects in many fields, e.g. disease detection (Tran et al., 2022; Dao et al., 2022; Le et al., 2020a), smart city (Minh et al., 2021), and forecasting (Ahmad et al., 2024; Ho et al., 2022 ). The application of ML techniques has grown in popularity recently and is progressively enhancing productivity by utilizing modern algorithms in the economy, industry, and agriculture (Tran et al., 2023a; 2023b; Lomakin et al., 2022; Ismat et al., 2022), etc. ML and predictive analytics employ different approaches to problem-solving, yet they share a connection. Predictive analytics applications can be seamlessly integrated into existing business systems, while machine learning offers greater adaptability and flexibility in addressing complex problems. Traditional predictive analytics, with its longer history in business intelligence, follows a more structured and procedural approach. It utilizes models that make predictions based on historical data patterns and serves specific purposes such as predicting pricing trends, drug dosage, risk analysis, propensity modeling, diagnosis, and document categorization (Kelleher et al., 2020). ML is an interdisciplinary field linked to mathematical fields (Shalev-Shwartz and BenDavid, 2014), providing a robust framework for addressing complex classification problems like bankruptcy prediction. Incorporating machine learning into bankruptcy prediction not only enhances the adaptability and accuracy of prediction models but also allows the integration of a broader array of data types beyond conventional financial data. Despite these advancements, a research gap remains in the comparative analysis and effectiveness of these ML models when integrated with traditional data sources in predicting bankruptcy. Most existing studies have focused on optimizing individual models without comprehensively examining hybrid approaches that combine traditional financial metrics with modern machine learning techniques.
The primary objectives of this study are: (1) to address the challenge of class imbalance in bankruptcy prediction using advanced resampling techniques; (2) to enhance model performance through optimal feature selection and hyperparameter tuning; (3) to compare the effectiveness of different ML models in the context of bankruptcy prediction; and (4) to propose a robust, adaptable framework for improving predictive accuracy in financial scenarios.
Using the UCI Taiwanese Bankruptcy Prediction Data Set from 1999 to 2009, this research compares several ML models, such as Random Forest (RF), Support Vector Machine (SVM), and Artificial Neural Network (ANN), to reduce this gap. We employ advanced resampling methods such as SMOTE-Tomek and SMOTE-ENN and feature selection through Binary Particle Swam Optimization (BPSO) to improve the predictive accuracy of our models. This approach not only allows us to determine which model offers the highest predictive performance or the lowest relative error but also contributes to the field by demonstrating the effectiveness of integrating ML techniques. Based on the evaluation metrics used, the enhanced ANN model, which incorporates parameter tuning, a feature selection algorithm, SMOTE-ENN, and finely tuned hyperparameters, shows remarkable superiority over conventional models. It has achieved an F1 Score of 98.5% and an accuracy rate of 98.6%. These results underscore the significant advantages of integrating various analytical strategies to boost the efficiency of models for predicting bankruptcy.
The rest of the paper is organized as follows: Section 2 reviews the relevant literature. Section 3 outlines the methodology, including the conceptual design description, approach comparison, and selection. Section 4 summarizes and analyzes the empirical results and discusses the findings. Finally, Section 5 presents the conclusions and offers insights for further research.
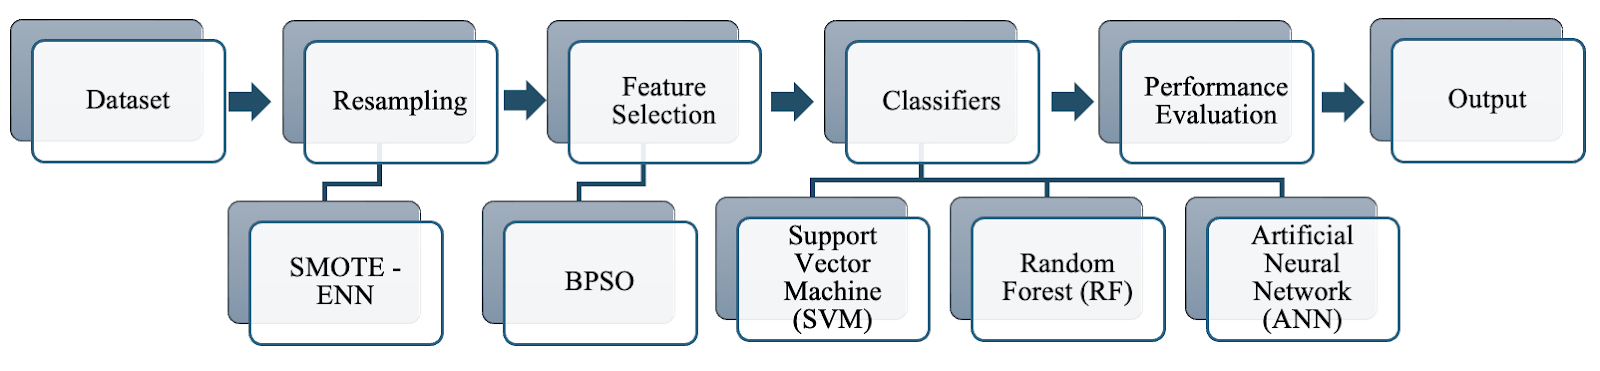
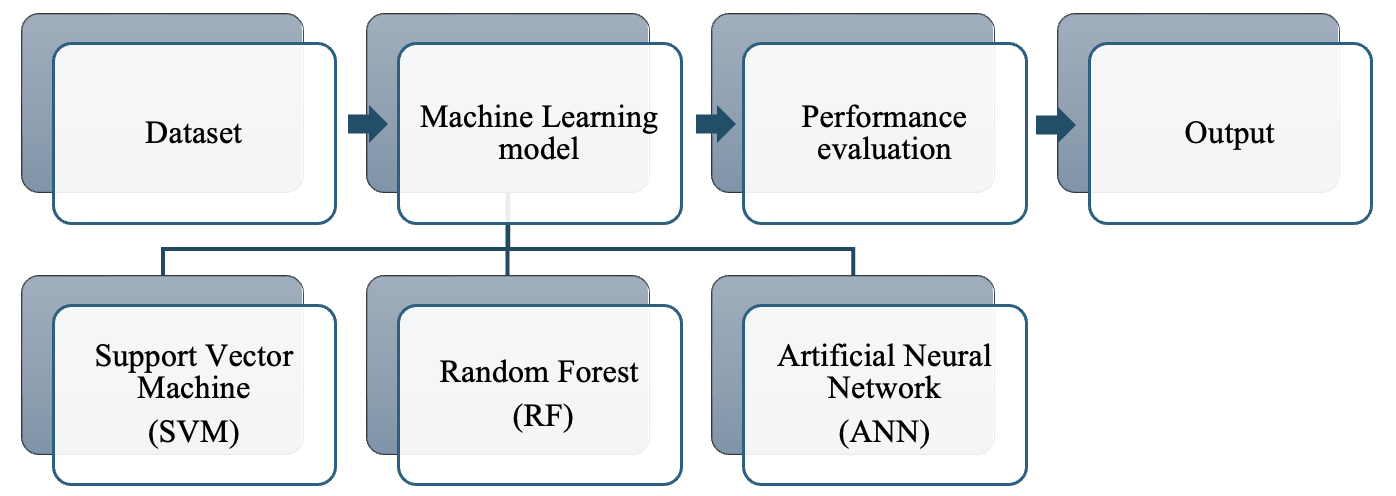
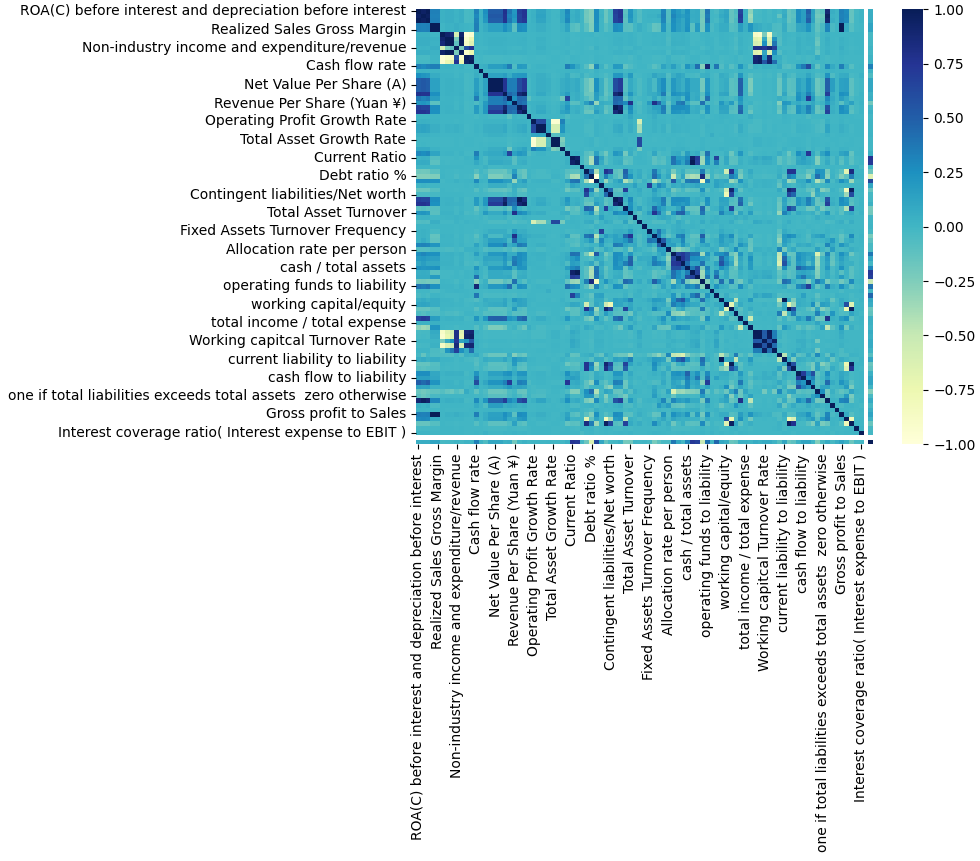
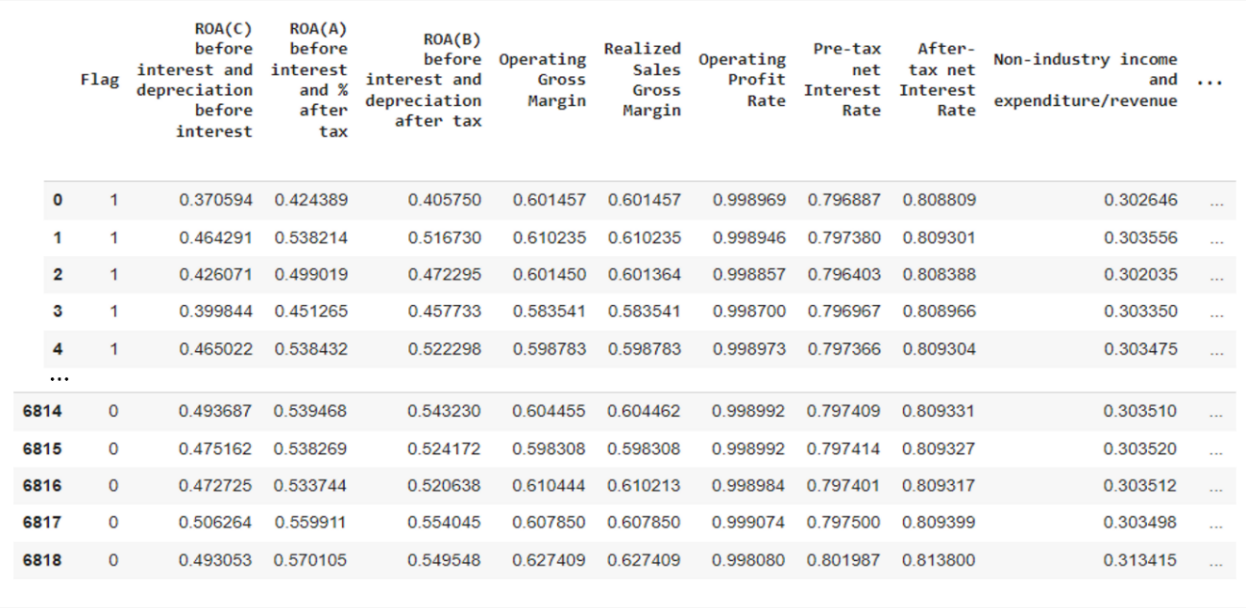
Literature Review 2.1. Data Resampling A skewed or biased distribution of examples across known classes is referred to as an imbalanced classification problem. The number of instances in a single class, known as the majority, is greater than the amount of data in the minority class. The imbalance ratio can vary dramatically, with one example in the minority class being compared to hundreds or thousands of examples in the majority class. The data obtained from the Taiwan Economic Journal (1999-2009) is used in this research. It contains 6819 instances and 96 attributes with two categories. Figure 1 demonstrates the massive imbalance with 6599 non-bankruptcy enterprises (96%) and 220 bankruptcy enterprises (4%). Generally, resampling methods can be categorized into three types. First, undersampling techniques address the class imbalance by eliminating instances from the majority class. The second type, oversampling methods, involves creating a larger dataset by replicating instances from the minority class. Finally, hybrid methods combine aspects of both undersampling and oversampling techniques. 2.1.1. Undersampling Methods Under-sampling methods include Random Undersampling (RUS), which aims to achieve a balanced dataset by randomly eliminating examples from the majority class, allowing for adjustment of the final balancing ratio. Tomek Links (Tomek) identifies pairs of instances from opposite classes that are nearest neighbors to each other and removes only examples from the majority class. The Condensed Nearest Neighbor Rule (US-CNN) reduces the dataset for k-nearest neighbor classification by eliminating examples from the majority class that are distanced from the decision boundary. The Neighborhood Cleaning Rule (NCL) combines the CNN Rule and the Edited Nearest Neighbors (ENN) Rule to remove superfluous and noisy/ambiguous examples, respectively. Class Purity Maximization (CPM) discovers pairs of centers, one from the minority class and one from the majority class, and divides the remaining instances into subsets with high-class purity. This process is repeated until no further clusters can be formed. Undersampling Based on Clustering (SBC) divides samples into k clusters using a clustering algorithm and randomly selects majority samples based on the proportion of majority to minority samples within each cluster. NearMiss approaches refer to a group of undersampling strategies that select samples based on the disparity between majority and minority class examples. 2.1.2. Oversampling Methods One such oversampling technique is the SMOTE, which generates synthetic examples by interpolating between existing minority instances. These synthetic examples are generated by considering the feature space rather than the data space, concentrating on positive instances that are close to each other (Chawla et al., 2002) (Sisodia & Verma, 2019). ADASYN is another type of oversampling technique that creates new instances of the minority category depending on the distribution and the degree of learning difficulty. Based on the ideas of correcting class imbalance and shifting the classification decision border to more difficult samples, ADASYN optimizes the distribution of data. 2.1.3. Hybridizations of Undersampling and Oversampling The objective of this hybridization technique is to find an optimal trade-off between removing the majority of examples and creating new minority examples. Over time, several hybrid approaches have been developed by combining SMOTE with subsequent cleaning techniques applied to the entire dataset, such as Tomek or ENN. Techniques such as SMOUTE (SMOTE with k-means) and CSMOUTE (Synthetic Majority Undersampling Technique and SMOTE) have been introduced (Koziarski, 2021). 2.2. Feature Selection The FS method identifies a set of representative variables from a given dataset, where the reduced-dimensional training dataset holds greater discriminatory power in distinguishing between classes than the original dataset. Previous research has demonstrated that a model produced using the dimension-reduced dataset is likely to perform better than a model built with the original dataset (Huynh et al., 2022; Le et al., 2021a; 2021b; 2021c; 2020b; Guyon & Elisseeff, 2003). The four primary processes in the feature selection process are usually subset creation, evaluation, stopping criteria, and result validation. First, various potential feature subsets are created using a specific search strategy. Each candidate subset is then assessed based on a particular criterion and compared to the current best subset. Finally, the optimal feature subset is validated using test data or prior knowledge. Feature selection can be approached through three main methods: Wrapper methods, Filter methods, and Heuristic search algorithms. Filter methods primarily focus on the characteristics of the data and can be seen as a preprocessing step. These methods evaluate features independently, which can lead to the oversight of possible data redundancy. They are quick in terms of processing time. The features are assigned scores based on a suitable ranking criterion, and those features that fall below a specified threshold are eliminated. Examples of filter methods consist of the Fisher Score, Mutual Information, and Pearson Correlation Criteria (Chandrashekar & Sahin, 2014). Wrapper methods treat the task (e.g., regression or classification) with the performance of the selected feature subset, determining the quality of the selection. These methods have the capability to handle redundancy but are often computationally expensive. Moreover, they run the risk of overfitting when the available data is insufficient. Another method for selecting features is to use heuristic search algorithms, including PSO and Genetic Algorithm (GA). The chosen subset aims to minimize the feature dimension while maximizing the model's performance. In summary, filter methods concentrate on the data features independently, wrapper methods consider the overall performance of the selected feature subset, and heuristic search algorithms explore the search space to seek a feature subset maximizing model performance while minimizing feature dimension. ML is one of the computer science fields that is expanding the fastest. It is well adapted to the complexities of dealing with disparate data sources, a variety of variables, and a huge amount of data, where machine learning thrives on increasing datasets (Osisanwo et al., 2017). In this study, Machine Learning mechanisms are deeply combined with data resampling methods, feature selection algorithm, and hyperparameter optimization to improve the prediction results. Our proposed methods are designed to distinguish between bankrupt companies and those that are not based on financial factors. The next section will review each of the mechanisms including SVM, RF, and ANN with specific objectives, mathematical modeling, and learning algorithms. 3.1. Conceptual Design Description The conceptual design model describes steps to apply different algorithms to handle binary class data. The main steps with suitable methods are listed in the sections below. The process of the proposed model is presented in Figure 1. The data processing step extracts features and resamples data using SMOTE-Tomek or SMOTE-ENN, then selects important features by applying feature selection methods (Binary PSO). The selected features are trained in the next step and optimized by Hyperparameter optimization. Then, three ML models such as SVM, ANN, and RF, are implemented to predict outputs, and the model's performance outcomes are compared and validated with the baseline model where the collected dataset is directly trained by machine learning models without any preprocessing steps, which described in Figure 2. Since the complexity of data processing, the results of these combinations outperform the results of other methods (Chou et al., 2017; Liang et al., 2016; 2015) which are known as only using the simple structure of baseline algorithms. Figure 1 The process for developing the proposed model. Figure 2 The process for developing a baseline model. 3.2. Approaches Comparison and Selection 3.2.1. Collection of Bankruptcy dataset The bankruptcy dataset was retrieved from the UCI Taiwanese Bankruptcy Prediction Data Set (Taiwanese Bankcruptcy Prediction, 2020). The business regulations of the Taiwan Stock Exchange were used to define company bankruptcy. As described above, the dataset comprised 6819 instances based on 96 attributes. The binary class dataset describes the instance as “Bankrupt” (6599 cases) or “non-bankrupt” (220 cases). This dataset has comprehensive financial attributes and a clear definition of bankruptcy. Additionally, the significant class imbalance in this dataset reflects real-world challenges in predicting rare events like bankruptcy, making it an ideal benchmark for testing advanced machine learning and resampling techniques. 3.2.2. Data Exploration and Deduplication The dataset is composed of a combination of 96 variables and 6819 observations. All of the features are numerical with integer numbers (3 features) or float numbers (93 features), and the data does not contain any missing values (Nan). However, features with duplicated values or have the same values as other features are removed, such as “Net Income Flag”, "Current Liabilities/Liability", " Current Liabilities/Equity" and "Gross Profit to Sales". The dataset is unbalanced, as the non-bankruptcy group dominates when its population is roughly 32 times more than that of the remaining class. 3.2.3. Data-level Techniques and Data Splitting This study employs two hybrid approaches for the data sampling step, combining the SMOTE with Tomek Link and the SMOTE with ENN (Batista et al., 2004). To increase the representation of the smaller class, the K-Nearest Neighbor (KNN) algorithm is first applied with SMOTE. This approach avoids randomly duplicating minority data. Additionally, the Tomek link is utilized to identify and remove points that extend into the region of another class. This step is crucial in mitigating potential issues related to overlap or overfitting. Unlike simple under-sampling, it should be noted that occurrences of both types can be eliminated. On the other hand, SMOTE-ENN employs a principle that is comparable to SMOTE-Tomek. Nevertheless, ENN identifies points for deletion using the KNN algorithm. Specifically, when the majority class of the selected point’s K-nearest observations is misclassified, those points are eliminated from the dataset. SMOTE-ENN is anticipated to yield a more refined dataset compared to SMOTE-TOMEK due to the elimination of a larger number of instances. The SMOTE-ENN technique, while effective for addressing class imbalance, has limitations. It may remove informative instances near class boundaries, leading to potential loss of critical data, and is computationally intensive compared to simpler methods. The training set and the testing test are the two distinct subsets of the data that are divided out before the pre-processing step. The testing set remains for evaluating the method, while the training set is used as a training sample for the model. The ratio for splitting is 80% training and 20% testing. 3.2.4. Feature Extraction and Correlation Analysis The number of features affects not only the accuracy but also the time required to train a model. The reason is that the dataset has many features that will make the training and classification process take more time. In addition, it also causes the program to take up more memory and hard disk space. Consequently, for ML methods, it is essential to choose from a smaller subset of characteristics while maintaining the classification process’s accuracy. This process is referred to as feature selection, and it is also referred to as feature reduction, attribute selection, or variable subset selection. Pearson’s correlation coefficient (r) is a well-known method for measuring the statistical relationship or association between features to each other and between features and labels. Therefore, this study conducts correlation analysis using this test to obtain information about the association of every pair of variables in the dataset using Equation (1). Where, x, y are mean values of two variables x and y. After that, the Pearson correlation heatmap was plotted and indicated in Figure 3 (Feature names on the x and y axes have been scaled to preserve the length of the figure and ensure that each letter is easily visible). The Pearson correlation coefficient (r) varies in the continuous range from -1 to 1, two features have no linear correlation while r equals 0, and two features have an absolute linear relationship when r equals -1 or 1. If the coefficient is 1, it is considered to be a positive correlation. This indicates that while one variable increases, the other increases as well. If the coefficient is -1, it is considered to be a negative correlation. When training the model, if the correlation between the predictors is larger than 0.9 or less than -0.9, one of these variables can be eliminated as a predictor. The shortlist of the feature pairs with high correlation scores can be seen in Table 1. The columns of “Debt ratio %”, “ROA(B) before interest and depreciation after-tax”, “ROA(C) before interest and depreciation before interest”, “Operating Profit Rate”, “Working capital Turnover Rate”, “Persistent EPS in the Last Four Seasons”, “Borrowing dependency”, “Net Income to Total Assets”, “Per Share Net profit before tax (Yuan ¥)”, “Current Liability to Equity”, “After-tax net Interest Rate”, “Continuous interest rate (after tax) ”, “After-tax Net Profit Growth Rate”, “Operating profit/Paid-in capital”, “Net Value Per Share (B)”, “Net Value Per Share (C)” and “Realized Sales Gross Margin” are dropped to avoid redundancy so that there are 75 variables remaining in the dataset. Table 1 The list of the feature pairs with high correlation Figure 3 Pearson correlation heatmap for original features. 3.2.5. Data Standardization The technique of standardization is widely employed in numerous ML models, such as SVM and ANN, for normalization. The process of converting data into a unified format to enable user processing and analysis is known as data standardization. Data standardization is important due to various factors. Each data column exhibits a unique range of values, including both negative and positive numbers, as well as a combination of integers and decimals. As a result, analyzing and comparing the data effectively becomes challenging without standardizing it into a uniform format. Upon implementing the Data Standardization step, a concise summary of the converted dataset is presented in Figure 4. To achieve dataset normalization using standardization, Equation (2) is applied to transform each x value within the dataset into its corresponding xstand value. where x is the original feature vector. 3.2.6. Feature Selection The PSO algorithm is a popular metaheuristic technique that draws inspiration from the collective behaviors observed in certain species in nature. PSO has demonstrated that this method converges to the optimal solution. One of the core elements that underpin the key idea of PSO is the concept of social interaction among the candidates within the population. In this search algorithm, a fitness function can be utilized. Since the wrapper technique wraps itself around the induction algorithm, it obtains better predictive accuracy estimates than filter models (Tang et al, 2014, Tuan et al, 2021). In this research, Binary PSO is selected as the heuristic search algorithm. In the PSO approach, each particle, representing a potential solution, exists as a point within a multi-dimensional search area. These particles possess personal memories, which retain the most successful solutions they have encountered individually and as a collective swarm. The movement of each solution through this search domain is governed by a velocity that evolves dynamically, shaped by its past successes and the experiences of other particles in the swarm. Figure 4 Dataset after the Data Standardization step. Initially, the swarm's particles are dispersed throughout the search space. The location of each particle is denoted by a vector, which corresponds to the dimensionality D of the search space. The velocity of the search where t is iteration, d The search algorithm comes to a halt when a predetermined stopping criterion is satisfied. This may differ in certain scenarios, such as feature selection and other optimization problems (Mafarja et al., 2018), which involve discrete search spaces. To tackle this challenge, a discrete binary variant of PSO known as BPSO, which is tailored for solving optimization problems in discrete domains. In BPSO, the update rule for the velocity remains unchanged from the original PSO. the key difference is that the variables xid, pid and pgdcan only take binary values of 0 or 1. As a result, the velocity indicates the probability that a particle in the position vector will have a value of 1. In BPSO, the position of the particle is dictated in Equation (5), utilizing the probability T(Vt) received from Equation (6). where S(v(t+ 1)) is the Sigmoid function and rand is a random number in the range [0,1]. The wrapper algorithm is guided by a fitness function, which evaluates the quality of the optimizer's solutions. This function should consider both the selected features and the classification performance to ensure an effective evaluation. The best solution should reflect a subset of features that yields lower features and higher classification performance value. The fitness function was inspired by the work of Vieira et al. (2013) is used in Equation (7): where [0,1] indicates the trade-off between the classification performance's error rate, and P is the classifier performance measure. Nf is the size of the tested feature subset and Nt is the total number of available input variables. It is important to note that both terms in the objective function are normalized. The value = 0.99 is also adopted. 3.2.7. Hyper-parameter Optimization The process of tuning hyperparameters (HPs) plays a crucial role in optimizing the performance of the ML model. Hyperparameters (HPs) are crucial because they define the model's structure before training and can either configure the ML model or determine the algorithm used for performance optimization (like the kernel type in SVM). Manual hyperparameter tuning has traditionally been employed but often proves inefficient due to the high dimensionality of parameters, the complexity of models, and the time-intensive nature of evaluations (Yang and Shami, 2020). To overcome these challenges, Hyperparameter Optimization (HPO) has been developed. HPO aims to automate and improve the hyperparameter tuning process. The Random Search (RS) method is chosen as the main HPO technique. For each classifier, RS will be executed for 20 iterations on the training set, utilizing the hyperparameter search space outlined in Table 2 for each model. By employing HPO, the expectation is to achieve an optimal machine learning model. Table 2 Hyper-parameters Search Space In this study, the rationale for selecting specific hyperparameters for each model was carefully considered to ensure optimal performance. For the SVM model, the kernel options (linear, polynomial, sigmoid, and RBF) were selected to address both linear and non-linear relationships within the data. The C parameter, which balances bias and variance, was varied between 0 and 50 to find an optimal trade-off, with higher values reducing bias at the expense of increased variance. In the case of Random Forest, the maximum tree depth maxdepthwas explored in the range of 5 to 50 to control tree complexity, while minsamples leaf (2-11) and minsamples split (2-11) were adjusted to ensure stable trees. The number of estimators (nestimator was varied between 10 and 100 to balance model stability and efficiency, and the Gini criterion was preferred for its computational efficiency, with entropy serving as an alternative. For the ANN, a variety of activation functions (softmax, ReLU, tanh, sigmoid, and linear) were evaluated to introduce non-linearity into the model. The Adam optimizer was chosen to facilitate faster convergence, and the number of neurons (ranging from 5 to 50) was fine-tuned to mitigate the risk of overfitting. These decisions reflect a systematic and tailored approach to hyperparameter optimization, addressing the specific requirements of each model. 3.2.8. Implementing Machine Learning Model This paper implements SVM, RF, and ANN as ML models to validate and compare the results. These algorithms were chosen for their complementary strengths: SVM excels in handling high-dimensional data and binary classification, RF is robust in managing diverse datasets and ranking feature importance, and ANN is highly effective in capturing non-linear relationships and complex patterns. Their selection ensures a comprehensive evaluation of predictive performance in bankruptcy detection. The purpose of the SVM model is to train a model that can classify data points within a given feature space. The fundamental idea surrounding SVM is the concept of a margin, which is essentially an area surrounding a hyperplane for classifying different classes of information. SVM identifies the best hyperplane that can best separate these classes with the maximum distance referred to as the margin to the closest points that are called the support vectors. In cases where the data is non-separable, such as in potential decision areas, kernel functions like linear polynomials or Gaussians (radial basis functions) are applied to transform the problem into a higher-dimensional space, making it separable and more tractable. (Sekeroglu et al., 2020). The separation hyperplane can be mathematically defined using Equation 8. where w is parameters, b is the distance from an example xi. There are two main hyper-parameters of SVM that are used to tune the model in the proposed approach: C is the regularization parameter and the kernel function type to be used in SVM. RF consists of multiple Decision Trees, each built from a randomly chosen subset of data samples. The process of building these trees involves selecting features at random during their development. For making predictions, RF aggregates the outcomes from all the trees in the ensemble, with the final prediction being the one that receives the majority of votes. Notably, each tree within the RF is allowed to grow to its maximum depth, as there is no pruning involved in this methodology (Mafarja et al., 2018). For RF, there are five hyper-parameters used for HPO: • nestimator: total number of trees. • maxdepth: the maximum depth allowed for the tree to grow. • minsamples leaf: the minimum number of samples allowed to be in a leaf node. • minsamples split: the minimum number of samples needed to split an internal node. • criterion: the function assesses the quality of each tree's split ANN refers to a special learning model that simulates how synapses work in the human brain. ANN consists of three primary parts: Input and output layers have only one layer each, whereas hidden layers might have one or more levels depending on the issue. ANN aims to describe how the nervous system functions by using neural connections. 3.2.9. Determining the performance of models The performancs of classifiers is assessed in terms of several measures such as Confusion Matrix, Accuracy, Precision, Recall, and F1 measure. These metrics give the overall evaluation of the classifier as various sides of the model’s prediction are examined. Since the classification is made between Bankruptcy and Non-Bankruptcy, i.e., a two-class classification problem, the ordinary Confusion Matrix is used to measure our classification model. There are four possible classification outcomes: • True-positive (TP): Points of bankruptcy are exactly classified. • False-positive (FP): Points are classified into the bankruptcy class, but in fact, they belong to a non-bankruptcy class. • True-negative (TN): The points of the non-bankruptcy class are clearly defined, with the boundaries of the non-bankruptcy class being distinctly outlined. • False-negative (FN): When classifying the points, some of them are classified into the non-bankruptcy class. However, they belong to the bankruptcy class. Accuracy is the ratio of correct prediction to the total records, which is shown in Equation (9). The precision is the ability of the classifier to not categorize as positive a sample that is negative. The worst value is 0, and the best value is 1, and Equation (10) is as follows: The recall can be defined as the ability of a classifier to find all of the positive samples. Its values range from zero to 1 (optimum), the recall is as Equation (11): The F1 score is calculated by taking the precision and recall harmonic mean, the Equation (12) of the F1 score depends completely upon precision and recall and is as follows: Its minimal value (of 0) is obtained whenever precision or recall is 0 (even if the other one is 1) and its maximal value (of 1) is obtained when both of them are 1.

 increases as each particle with coordinates
  travels in the search space to locate the best solution. As they move, particles modify their positions and speeds, drawing on their own experiences and those of their neighbors. Every particle has a memory that records its most successful location, known as pbest. The entire swarm's optimum experience is referred to as the global best, symbolized by gbest. Every time a particle iterates, its location, and velocity are formatted using Equations 3 and 4 (Chawla et al., 2002):
 D is a dimension in the search space, w is inertia weight, c1 and c2 are cognitive and social acceleration coefficients, r1 and r2 are randomly and uniformly distributed numbers in the range of [0, 1]. pid (is also pbest) represents the local best in dimension dth, while gid indicates the global best in dimension dth, which is also referred to as gbest.


4.1. Baseline Results
In the baseline model, Oversampling techniques, FS method, and HPO are not performed. All 75 features will be classified by three classifier algorithms with the hyper-parameters: SVM with C =1; RF with maxdepth: None, minsamples leaf: 1, minsamples split: 2, nestimator: 100, criterion: gini; and ANN with Activation = linear, Optimizer = Adam, Neurons: 5
Four popular types of kernels in SVM are applied to find out which kernel is the most appropriate for the dataset. All parameters are set at the default values, especially C equal to 1.
RF is a supervised ML algorithm based on the ensemble learning concept in which multiple Random Forest classifiers are combined together, so it has both the simplicity of a Decision Tree and the flexibility to solve complex problems. All parameters are set at the default values as shown in the table above.
In the ANN baseline model, the model will have three layers, namely, one input layer, one hidden layer, and one output layer. The input layer uses 5 nodes and requires relative activation. Then, the output layer uses one number of nodes and the sigmoid activation function. Since the dataset is partitioned randomly, the program runs 5 times to get an objective observation and accuracy conclusion. The results with average F1 scores and accuracies are shown in Table 3.
Table 3 Evaluation metrics of baseline models
4.2. Results of Model Improvement
4.2.1. The advanced approach using balancing techniques (SMOTE-Tomek and SMOTE-ENN)
SMOTE-Tomek and SMOTE-ENN are applied to make the dataset balanced. Figure 5 demonstrates that the two classes, bankruptcy, and non-bankruptcy, have the same ratio and an equal number of instances after applying balancing techniques. Table 4 presents the average F1 scores and accuracy of the models following the data balancing implementation.
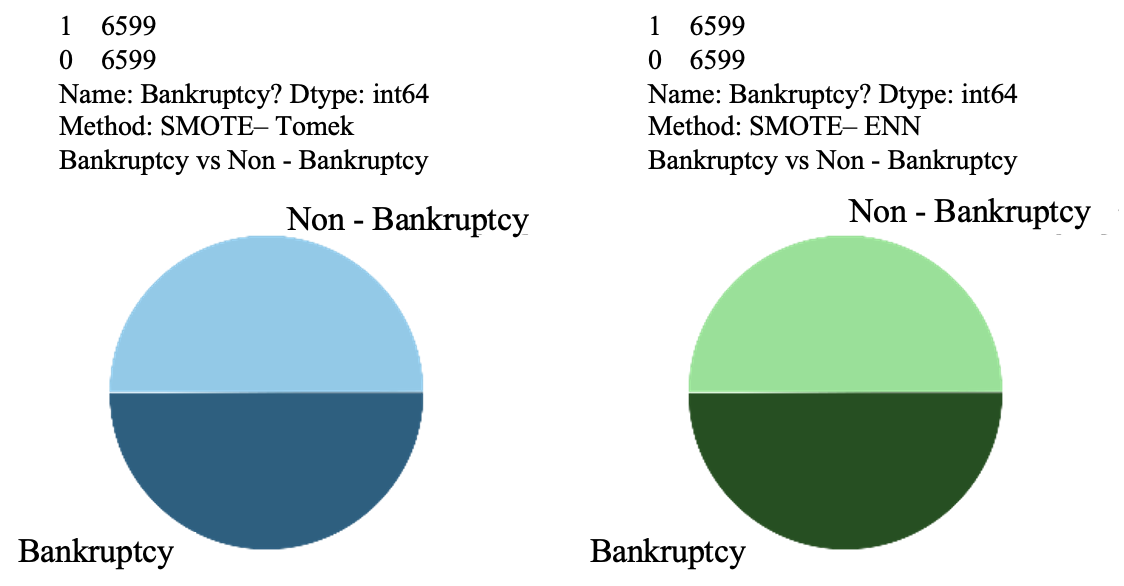
Figure 5 The ratio of Bankruptcy to non-bankruptcy after using Data balancing (SMOTE-Tomek and SMOTE-ENN).
Table 4 Average F1 score and Accuracy of models after using SMOTE-Tomek and SMOTE-ENN balancing data techniques
4.2.2. Feature selection using Binary PSO
The feature selection process using Binary PSO (BPSO) was configured with specific parameter values to ensure efficient optimization. The process runs for a maximum of 1000 iterations. The cognitive coefficient (c1?) and the social coefficient (c2:) were both set to 0.7, reflecting a balanced influence between individual and social components in the particle updates. The inertia weight (w) was set at 0.5 to maintain a balance between exploration and exploitation during the search process. Each particle considers 75 neighbors (k) in its decision-making, and the total number of particles in the swarm was set to 75, ensuring sufficient diversity in the search space.
Figure 6 shows the convergence curve (cost history) of the fitness function during the iterations. The FS-BPSO algorithm achieves an optimal fitness value of bestcost = 0.1218).
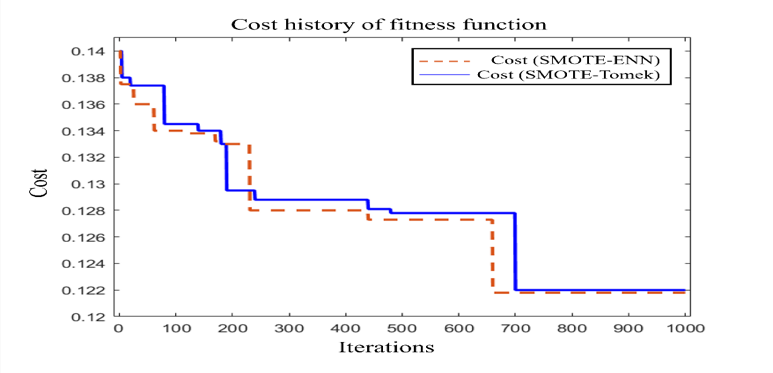
Figure 6 Convergence Curve (Cost History) of Fitness Function of the balanced dataset (generated by SMOTE-Tomek and SMOTE-ENN
Notably, FS-BPSO selects 34 features from the original set of 75 features, resulting in a reduction of feature dimension by 55%. This method uses a particle swarm optimization (PSO) framework adapted to binary search spaces, enabling it to effectively evaluate feature subsets by balancing feature relevance and redundancy. The specific features selected are listed in Table 5. These features include critical financial ratios (e.g., debt ratio, equity to liability), profitability indicators (e.g., net income to stockholder’s equity, operating profit per share), liquidity and cash flow metrics (e.g., quick assets/current liability, cash flow to total assets), and operational efficiency metrics (e.g., total asset turnover, working capital to equity). Such features capture essential dimensions of financial health and operational sustainability, enhancing model performance. BPSO optimizes feature selection by minimizing dimensionality while maximizing classification accuracy, which ensures the inclusion of features with high predictive power.
Table 5 The list of selected features.
The method inherently prioritizes features that align with established financial theories, such as Altman’s Z-score, which highlights the significance of financial ratios in evaluating bankruptcy risk. It also considers widely recognized metrics of profitability, liquidity, and efficiency, which are key indicators of financial stability. This holistic feature set enhances the efficiency and generalizability of the model, demonstrating the effectiveness of BPSO in identifying the most relevant and informative predictors for bankruptcy prediction. A correlation heatmap for the 34 features that were selected is shown in Figure 7. The remaining features exhibit correlations below 0.86 or above -0.86, indicating a weak to Thank you for the revisions. virtually no correlation among them.
4.2.3. Hyper-parameter Optimization
The hyper-parameters in Table 6 were obtained through the Random Search HPO method. Random search utilized accuracy as the scoring metric to determine the optimal hyper-parameters.
Table 6 Optimal Hyper-parameters Results with Random Search.
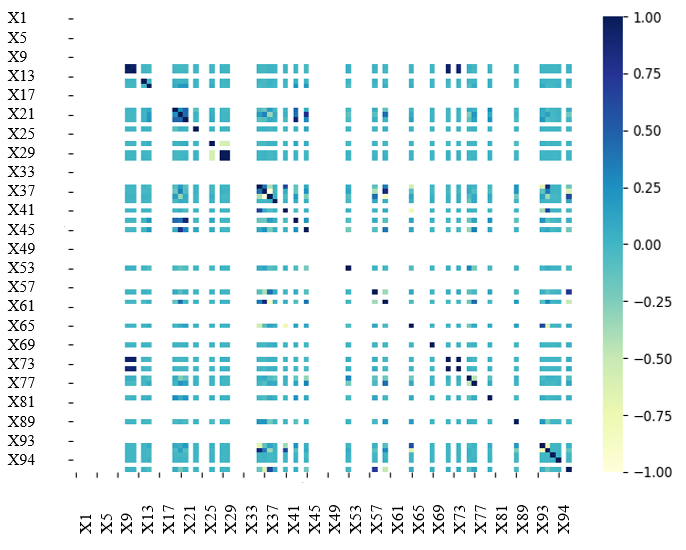
Figure 7 Pearson correlation heatmap.
4.3. Proposed Model Results
To perform the classification of two proposed models with SMOTE-Tomek and SMOTE-ENN on the test set, the classifiers are configured with the hyperparameters. The initial results of the proposed model, summarized in Table 7, are distinct from the baseline results. These initial results demonstrate significant improvements compared to both the baseline results (shown in Table 8) and the results from key references, as depicted in Table 10. Among the classifiers, ANN with SMOTE-ENN achieved the highest accuracy of 98.5%. Their recall and F1 scores are also higher than those of the SVM and RF classifiers. The confusion matrices for the SVM, RF, and ANN classifiers for the two proposed models are presented in Figure 8 and Figure 9. Notably, ANN with SMOTE-ENN accurately predicted 1285 out of the total 1320 'non-bankruptcy' cases, while Random Forest with SMOTE-ENN correctly predicted 1271 out of 1320 'non-bankruptcy' cases. However, SVM's performance in predicting 'non-bankruptcy' instances was relatively weaker, with only 1254 cases correctly predicted and 23 instances falsely predicted. Furthermore, RF of the SMOTE-Tomek method accurately predicted 1266 out of the total 1320 ’non-bankruptcy’ cases, while the numbers of SVM and ANN in similar methods are respectively 1209 and 1278.
Table 7 Proposed Model Result Summary.
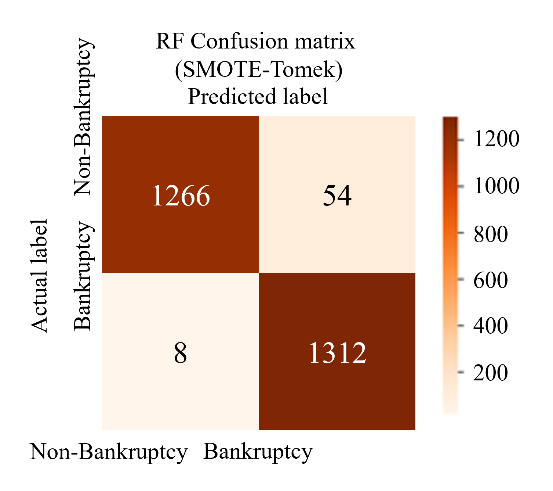

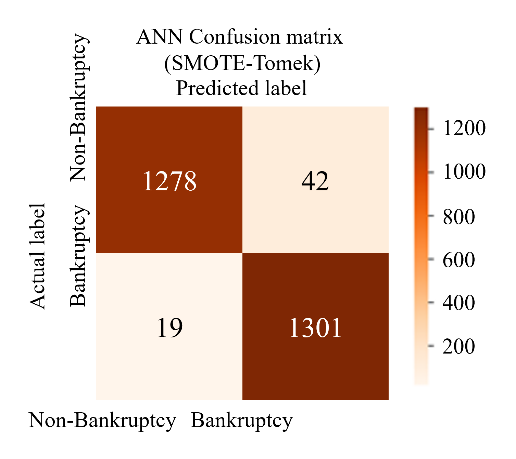
Figure 8 The confusion Matrices of SVM - RF - ANN model (SMOTE-Tomek)


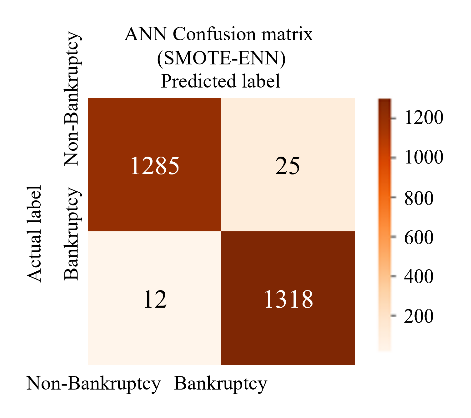
Figure 9 The confusion Matrices of SVM - RF - ANN model (SMOTE-ENN)
4.4. Results Comparison
4.4.1. Compare With Baseline Results
The proposed model outperforms the baseline model, achieving more promising results while utilizing fewer features, as shown in Table 9. Performance improvement is particularly notable for the SVM classifier. Other classifiers like RF and ANN also exhibit enhancements across all evaluation metrics for all of these two proposed methods. The primary challenge addressed in this study is the imbalance between the two classes in the dataset. To overcome this, the study employs resampling techniques, specifically SMOTE-Tomek and SMOTE-ENN. The results demonstrate the significant improvement achieved through the advanced approach. The application of these two methods has a crucial role in enhancing performance.
The RBF kernel SVM model, which utilizes parameter tuning (C=40) and a balanced dataset created through SMOTE-Tomek and SMOTE-ENN, along with feature selection performed by Binary PSO, demonstrates exceptional performance. It attains an accuracy score of 0.95 and an F1 score of 0.952. The RF model and ANN model achieve slightly higher scores with accuracy and F1 score of 0.977 for SMOTE-Tomek while these numbers of SMOTE-ENN respectively, 0.962, 0.978, 0.986 for Accuracy of SVM (RBF Kernel), RF, and ANN model.
Table 8 Comparison between the Suggested Models and Baseline Results
4.4.2. Compare With Key Reference
Compared to the three aforementioned references that were conducted on the same Taiwan bankruptcy dataset, the highlight of the proposed model is the application of a binary wrapper-based feature selection, which is the Binary PSO. Moreover, in the data pre-processing step, Pearson’s correlation is conducted to eliminate high-correlation pairs of features, which has not been previously considered by Chou et al. (2017), Liang et al. (2016), and Liang et al. (2015). All three reference papers used a method of stratified sampling and multilayer perceptron to collect the same number of bankrupt and non-bankrupt cases. This study also tries model improvement approaches, including hyper-parameter tuning and threshold optimization. With all these innovation aspects, the proposed model trains the dataset with a few selected features, which is less computationally expensive and may avoid overfitting compared to previous works on the same problem as discussed in Table 10.
The results clearly show the superiority of the proposed hybrid model with SMOTE-ENN and ANN, which achieves an accuracy of 98.6%—significantly higher than all compared models in the literature. For instance, the fuzzy clustering with backpropagation neural network (BPNN) was used by Chou et al. (2017) reached an accuracy of 95.25%, while the AWOA-DL model by Elhoseny et al. (2022) attained 95.77%. These models, though effective, did not employ advanced feature selection or hybrid resampling techniques.
The highest average score achieved by the proposed SMOTE-ENN ANN model, as presented in Table 9, highlights its superior performance compared to previously studied models. This result reflects the robustness and reliability of the proposed model in accurately predicting bankruptcy. Achieving the highest score indicates that combining SMOTE-ENN for resampling, Binary PSO for feature selection, and ANN for classification contributes to a better balance between precision and recall, minimizing false positives and false negatives. This is particularly significant in the context of financial risk assessment, where accurate prediction is crucial for minimizing economic losses and guiding better decision-making for investors, analysts, and policymakers.
This performance highlights the practicality and reliability of the proposed model, setting a new standard for bankruptcy prediction. Investors can rely on the model to evaluate financial health and make better decisions
Table 9 The results of reference papers in the same dataset (Taiwan bankruptcy dataset).
This study presents a machine learning approach for detecting bankruptcy using data from the Taiwan Economic Journal covering the years 1999 to 2009. The methods employed include Support Vector Machines (SVM), Random Forest (RF), and Artificial Neural Networks (ANN) for classification. Additionally, the study incorporates feature selection, over- and undersampling techniques, and parameter optimization. Initial baseline models were run on raw data, followed by Pearson’s correlation analysis to eliminate highly correlated features and data standardization for consistency. The data imbalance was addressed using SMOTE-Tomek and SMOTE-ENN resampling techniques, and Binary PSO selected 34 features. Randomized Search fine-tuned hyperparameters, with the resampling technique significantly improving model performance. The ANN model, incorporating parameter tuning, Binary PSO, and SMOTE-ENN, achieved the highest results with a 98.5% F1 Score and 98.6% accuracy. This framework can be used as a scorecard for business credit risk evaluation, premium assessment in insurance, and to inform better credit and investment decisions. It supports real-time compliance and strategic planning, enhancing predictive accuracy and reliability. The study addresses class imbalance and feature redundancy, demonstrating the efficiency and robustness of the proposed model, which can be adapted for different industries. The SMOTE-ENN ANN model offers valuable insights for investors, financial analysts, and policymakers by improving financial risk assessments and supporting data-driven decisions. Future research will expand parameter search ranges and explore other ML algorithms to improve performance and applicability across various sectors further.
Abbreviations
This work has been conducted through the RMIT Vietnam Research Grants-2024, administered by the Office for Research & Innovation.
Author Contributions
Conceptualization, Son V. T. Dao; methodology, Hung V. Pham, Son V. T. Dao, Tuan M. Le.; software, Hieu M. Tran, Huong T. K. Tran; validation, Tuan Chu, Hung V. Pham, Son V. T. Dao; writing—original draft preparation, Tuan Chu, Khanh N. Yen, Hieu M. Tran and Tuan M. Le.; writing—review and editing, Hung V. Pham, Son V. T. Dao, Tuan M. Le; supervision, Hung V. Pham, Son V. T. Dao. All authors have read and agreed to the published version of the manuscript."
Conflict of Interest
The authors declare no conflicts of interest.
| Filename | Description |
|---|---|
| R3-EECE-7227-20241224100530.pdf | Manuscript file in pdf format |
Ahmad, FA, Liu, J, Hashim, F & Samsudin, K 2024, 'Short-term load forecasting utilizing a combination model: A brief review', International Journal of Technology, vol. 15, no. 1, pp. 121-129, https://doi.org/10.14716/ijtech.v15i1.5543 Batista, GEAP, Prati, RC & Monard, MC 2004, 'A study of the behavior of several methods for balancing machine learning training data', SIGKDD Explorations, vol. 6, no. 1, pp. 20-29, https://doi.org/10.1145/1007730.1007735 Brenes, RF, Johannssen, A. & Chukhrova, N 2022, ‘An intelligent bankruptcy prediction model using a multilayer perceptron’, Intelligent Systems with Applications, vol. 16, article 200136, Chandrashekar, G & Sahin, F 2014, 'A survey on feature selection methods', Computers & Electrical Engineering, vol. 40, no. 1, pp. 16-28, https://doi.org/10.1016/j.compeleceng.2013.11.024 Chawla, NV, Bowyer, KW, Hall, LO & Kegelmeyer, WP 2002, 'SMOTE: Synthetic minority over-sampling technique', Journal of Artificial Intelligence Research, vol. 16, pp. 321-357, https://doi.org/10.1613/jair.953 Chen, S & Shen, ZD 2020, 'Financial distress prediction using hybrid machine learning techniques', Asian Journal of Economics, Business and Accounting, pp. 1-12, https://doi.org/10.9734/ajeba/2020/v16i230231 Chou, CH, Hsieh, SC & Qiu, CJ 2017, 'Hybrid genetic algorithm and fuzzy clustering for bankruptcy prediction', Applied Soft Computing, vol. 56, pp. 298-316, https://doi.org/10.1016/j.asoc.2017.03.014 Dao, SVT, Yu, Z, Tran, LV, Phan, PNK, Huynh, TTM & Le, TM 2022, 'An analysis of vocal features for Parkinson’s disease classification using evolutionary algorithms', Diagnostics, vol. 12, no. 8, article 8, https://doi.org/10.3390/diagnostics12081980 Elhoseny, M, Metawa, N, Sztano, G & El-Hasnony, IM 2022, 'Deep learning-based model for financial distress prediction', Annals of Operations Research, pp. 1-23, https://doi.org/10.1007/s10479-022-04766-5 Guyon, I & Elisseeff, A 2003, 'An introduction to variable and feature selection', Journal of Machine Learning Research, vol. 3, pp. 1157-1182 Ho, TTM, Tran, LV, Tran, HM & Dao, SVT 2022, 'Machine learning in demand forecasting', International Research Journal of Advanced Engineering and Science https://doi.org/10.1016/j.iswa.2022.200136. Huo, Y, Chan, LH & Miller, D 2024, 'Bankruptcy prediction for restaurant firms: A comparative analysis of multiple discriminant analysis and logistic regression', Journal of Risk and Financial Management, vol. 17, no. 9, p. 399, https://doi.org/10.3390/jrfm17090399 Huynh, TTM, Le, TM, That, LT, Tran, LV & Dao, SVT 2022, 'A two-stage feature selection approach for fruit recognition using camera images with various machine learning classifiers', IEEE Access, vol. 10, pp. 132260-132270, https://doi.org/10.1109/ACCESS.2022.3227712 Ismat, MN, Chin Poo Lee, HY Tan, TK Neo, YX Tan, NMahendru & Zahra 2024, 'Enhancing students’ online learning experiences with artificial intelligence (AI): The MERLIN project', IJTech - International Journal of Technology, retrieved December 23, 2024, from https://ijtech.eng.ui.ac.id/article/view/5843 Kelleher, JD, Mac Namee, B & D’arcy, A 2020, Fundamentals of machine learning for predictive data analytics: algorithms, worked examples, and case studies, MIT Press Koziarski, M 2021, 'CSMOUTE: Combined synthetic oversampling and undersampling technique for imbalanced data classification', arXiv, https://doi.org/10.48550/arXiv.2004.03409 Le, MT, Thanh Vo, M, Mai, L & Dao, SVT 2020, 'Predicting heart failure using deep neural network', 2020 International Conference on Advanced Technologies for Communications (ATC), pp. 221-225, https://doi.org/10.1109/ATC50776.2020.9255445 Le, MT, Vo, MT, Pham, NT & Dao, SVT 2021, 'Predicting heart failure using a wrapper-based feature selection', Indonesian Journal of Electrical Engineering and Computer Science, vol. 21, no. 3, article 3, https://doi.org/10.11591/ijeecs.v21.i3.pp1530-1539 Le, TM, Tran, LV & Dao, SVT 2021a, 'A feature selection approach for fall detection using various machine learning classifiers', IEEE Access, vol. 9, pp. 115895-115908, https://doi.org/10.1109/ACCESS.2021.3105581 Le, TM, Vo, TM, Pham, TN & Dao, SVT 2021b, 'A novel wrapper-based feature selection for early diabetes prediction enhanced with a metaheuristic', IEEE Access, vol. 9, pp. 7869-7884, https://doi.org/10.1109/ACCESS.2020.3047942 Liang, D, Lu, CC, Tsai, CF & Shih, GA 2016, 'Financial ratios and corporate governance indicators in bankruptcy prediction: A comprehensive study', European Journal of Operational Research, vol. 252, pp. 561-572 Liang, D, Tsai, CF & Wu, HT 2015, 'The effect of feature selection on financial distress prediction', Knowledge-Based Systems, vol. 73, pp. 289-297, https://doi.org/10.1016/j.knosys.2014.10.010 Lomakin, NL, Maxim, M, Maramygin, A, Kataev, A, Kraschenko, S, Yurova, O & Ivan 2024, 'Cognitive model of financial stability of the domestic economy based on artificial intelligence in conditions of uncertainty and risk', IJTech - International Journal of Technology, retrieved December 23, 2024, from https://ijtech.eng.ui.ac.id/article/view/6185 Mafarja, M, Jarrar, R, Ahmad, S & Abusnaina, AA 2018, 'Feature selection using binary particle swarm optimization with time varying inertia weight strategies', Proceedings of the 2nd International Conference on Future Networks and Distributed Systems, pp. 1-9, https://doi.org/10.1145/3231053.3231071 Minh, HT, Mai, L & Minh, TV 2021, 'Performance evaluation of deep learning models on embedded platform for edge AI-based real-time traffic tracking and detecting applications', 2021 15th International Conference on Advanced Computing and Applications (ACOMP), pp. 128-135, https://doi.org/10.1109/ACOMP53746.2021.00024 Najib, AS & Cahyaningdyah, D 2020, 'Analysis of the bankruptcy of companies with Altman model and Ohlson model', Management Analysis Journal, vol. 9, no. 3, article 3, https://doi.org/10.15294/maj.v9i3.37797 Osisanwo, FY, Akinsola, JET, Awodele, O, Hinmikaiye, JO, Olakanmi, O & Akinjobi 2024, 'Supervised machine learning algorithms: Classification and comparison', Seventh Sense Research Group, Viewed 18 March, 2024 (https://dev.ijcttjournal.org//archives/ijctt-v48p126) Prasetiyani, E & Sofyan, M 2020, 'Bankruptcy analysis using Altman Z-Score model and Springate model in retail trading company listed in Indonesia Stock Exchange', Ilomata International Journal of Tax and Accounting, vol. 1, no. 3, pp. 139-144, https://doi.org/10.52728/ijtc.v1i3.98 Sekeroglu, B, Hasan, SS & Abdullah, SM 2020, 'Comparison of machine learning algorithms for classification problems', in K Arai & S Kapoor (eds.), Advances in Computer Vision, pp. 491-499, Springer International Publishing, https://doi.org/10.1007/978-3-030-17798-0_39 Shalev-Shwartz, S & Ben-David, S 2014, Understanding machine learning: From theory to algorithms, Cambridge University Press, https://doi.org/10.1017/CBO9781107298019 Sisodia, DS & Verma, U 2024, 'Distinct multiple learner-based ensemble SMOTEBagging (ML-ESB) method for classification of binary class imbalance problems', International Journal of Technology. vol. 10 no. 4, pp. 721-730, https://ijtech.eng.ui.ac.id/article/view/1743 Taiwanese bankruptcy prediction [dataset] 2020, UCI Machine Learning Repository, https://doi.org/10.24432/C5004D Tang, J, Alelyani, S & Liu, H 2014, 'Feature selection for classification: A review', in Data Classification, CRC Press, pp. 37-64, https://doi.org/10.1201/b17320 Tobback, E, Bellotti, T, Moeyersoms, J, Stankova, M & Martens, D 2017, 'Bankruptcy prediction for SMEs using relational data', Decision Support Systems, vol. 102, pp. 69-81, https://doi.org/10.1016/j.dss.2017.07.004 Tran, HM, Pham, KT, Vo, TM, Le, TH, Huynh, TTM & Dao, SVT 2023a, 'A new approach for estimation of physical properties of irregular shape fruit', IEEE Access, vol. 11, pp. 46550-46560, https://doi.org/10.1109/ACCESS.2023.3273777 Tran, HM, Pham, KT, Vo, TM, Tonthat, L, Huynh, TTM & Dao, SVT 2023b, 'Physical characteristics estimation for irregularly shaped fruit using two cameras', 2023 IEEE Statistical Signal Processing Workshop (SSP), pp. 165-169, https://doi.org/10.1109/SSP53291.2023.10207992 Tran, LV, Tran, HM, Le, TM, Huynh, TTM, Tran, HT & Dao, SVT 2022, 'Application of machine learning in epileptic seizure detection', Diagnostics, vol. 12, no. 11, article 11, https://doi.org/10.3390/diagnostics12112879 Tuan, L, Pham, T & Dao, S 2021, 'A novel wrapper-based feature selection for heart failure prediction using an adaptive particle swarm grey wolf optimization', In: Enhanced Telemedicine and e-Health, pp. 315-336, https://doi.org/10.1007/978-3-030-70111-6_15 Vieira, SM, Mendonça, LF, Farinha, GJ & Sousa, JMC 2013, 'Modified binary PSO for feature selection using SVM applied to mortality prediction of septic patients', Applied Soft Computing, vol. 13, no. 8, pp. 3494-3504, https://doi.org/10.1016/j.asoc.2013.03.021