Integrating Taguchi Method and Finite Element Modelling for Precision Ball Joint Manufacturing with AISI 1045 Medium Carbon Steel
Corresponding email: surasak.sur@kmutt.ac.th
Published at : 24 Dec 2024
Volume : IJtech
Vol 15, No 6 (2024)
DOI : https://doi.org/10.14716/ijtech.v15i6.7132
SIripath, N., Jantepa, N., Sucharitpwatskul, S., Suranuntchai, S., 2024. Integrating Taguchi Method and Finite Element Modelling for Precision Ball Joint Manufacturing with AISI 1045 Medium Carbon Steel. International Journal of Technology. Volume 15(6), pp. 1801-1822
| Nattarawee SIripath | Department of Tool and Materials Engineering, Faculty of Engineering, King Mongkut’s University of Technology, Thonburi, Bangkok, 10140, Thailand |
| Naiyanut Jantepa | Department of Tool and Materials Engineering, Faculty of Engineering, King Mongkut’s University of Technology, Thonburi, Bangkok, 10140, Thailand |
| Sedthawatt Sucharitpwatskul | National Science and Technology Development Agency, Thailand Science Park, Phahonyothin Road, Khlong Nueng, Khlong Luang, Pathum Thani, 12120, Thailand |
| Surasak Suranuntchai | Department of Tool and Materials Engineering, Faculty of Engineering, King Mongkut’s University of Technology, Thonburi, Bangkok, 10140, Thailand |

This study optimized the hot forging conditions for AISI 1045 medium carbon steel ball joints by integrating the Taguchi method with Finite Element Method (FEM) simulations. The research focused on three key process parameters: billet temperature (1000-1200°C), billet length (153-160 mm), and friction factor (0.15-0.64). The analysis of Variance (ANOVA) identified billet temperature and friction factor as the most influential parameters, accounting for over 96% of the variation in forging loads. Optimal forging conditions were determined as a billet temperature of 1200°C, billet length of 153 mm, and friction factor of 0.15. The linear regression models exhibited high predictive accuracy, with R² values of 0.978 and 0.988 for maximum preforming and finishing loads, respectively. FEM simulations incorporating the Johnson-Mehl-Avrami-Kolmogorov (JMAK) model effectively predicted the microstructural evolution with grain sizes ranging from 5.10 to 41.22  , showing a mean deviation of 15.51% from experimental measurements. The simulations also accurately predicted the pearlite phase transformation, achieving a 37-42% pearlite volume fraction with only a 5.33% error and tensile strength distributions ranging from 642.04 to 642.12 MPa. Experimental validation confirmed defect-free die cavity filling, with FEM simulations and predictive models showing satisfactory agreement with experimental forming loads for both preforming and finishing stages. This integrated approach offers a robust framework for optimizing complex forging processes, ensuring consistent product quality, and minimizing material waste.
ANOVA; FEM; hot forging; JMAK microstructure evolution model; Taguchi method
In the automotive industry, producing high-quality components ensures vehicle safety, durability, and optimal performance. Hot forging, a fundamental process that shapes metals by heating and deformation, plays a vital role in achieving these objectives. Forging, one of the oldest metalworking techniques, continues to be widely used in modern manufacturing because of its unmatched reliability, efficiency, and capacity to deliver superior mechanical properties. Additionally, it reduces material waste, making it indispensable in sectors such as aerospace, automotive, and agriculture (Harris, 2014; Altan, 2005). The hot forging process involves shaping a malleable metal billet through hammering and pressing, which induce plastic deformation at approximately 75% of the material’s melting point. The process involves heating the billet to its plastic deformation temperature and forging it between dies to achieve the desired shape, which refines the coarse-grain structure of the billet into finer grains. After the forging process, the product typically undergoes an additional heat treatment (Zhan, Sun, and Yang, 2014; Debin and Lin, 2014).
Key factors, such as the direction, extent of deformation, and temperature, significantly influence component properties and the formation of defects like cracks and folds. Process variables, such as billet characteristics, deformation zone conditions, equipment specifications, product requirements, and environmental factors, play a complex role in shaping local metal flow dynamics. Consequently, a comprehensive understanding and precise control of these variables are critical for successful forging. Despite its numerous advantages, hot forging poses significant challenges, particularly when dealing with complex components. Producing such parts often requires a time-intensive and costly trial-and-error approach (Tempelman et al., 2014; Movrin et al., 2010), whereas conventional methods may result in excessive material waste and dimensional inaccuracies. Overcoming these challenges requires innovative solutions and a strong focus on optimizing forging processes within modern manufacturing frameworks.
The introduction of computer simulations, particularly the Finite Element Method (FEM), has revolutionized the design process for forged products since its adoption in the 1980s. FEM is a reliable and efficient tool for Product development, significantly reducing both time and cost (Schaeffer et al., 2005). However, relying solely on FEM to determine optimal forging parameters can be computationally intensive and time-consuming. In this context, the Taguchi method proves invaluable. This systematic approach helps identify optimal conditions for manufacturing high-quality automotive parts, thereby reducing variability and Enhancing overall product performance.
Numerous studies have Highlighted the effectiveness of the Taguchi method in optimizing the process parameters for forging. For instance, Equbal et al. (2012) integrated the Taguchi method with finite element (FE) simulations to optimize the performance design in closed-die forging, successfully minimizing the forging load and producing defect-free components. Similarly, Rathi and Jakhade (2014) utilized the Taguchi method alongside signal-to-noise (S/N) ratio analysis to optimize process parameters and reduce rejection rates caused by unfilling defects in hot forging. Al-Arifi et al. (2011) applied the Taguchi method to optimize the design parameters of a steering knuckle die, thereby demonstrating its effectiveness in determining optimal settings for complex geometries. The Taguchi method's ability to address multiple performance criteria is particularly advantageous for forging optimization. For instance, Pinaki Talukdar (2015) combined the Taguchi method with Grey Relational Analysis (GRA) to optimize the hot-forging process of medium carbon steel, thereby simultaneously enhancing the tensile and impact strengths. Byun and Lee (2017) proposed a hybrid approach both combined the Taguchi method with Multiple Criteria Decision Making (MCDM) to optimize aluminum piston forging. This method considers multiple performance characteristics, such as forming load and die stress, to provide a more comprehensive optimization strategy. Obiko et al. (2020) employed the Taguchi method with Deform™ 3D simulation software to optimize the forging parameters of X20 steel, focusing on minimizing the maximum tensile stress and forging force while enhancing the product quality. Satyam et al. (2021) demonstrated the potential of combining the Six Sigma DMAIC (Define, Measure, Analyze, Improve, Control) approach with FEM simulations and response surface methodology to optimize the hot forging of connecting rods, significantly reducing the forging die load. The integration of the Taguchi method with FEM simulations Offers a robust framework for optimizing hot forging processes. The reviewed literature highlights the versatility and effectiveness of the Taguchi method for optimizing various aspects of forging operations. The method enables the identification of optimal process parameters, supports multi-criteria optimization, and seamlessly integrates with FEM simulations to provide a robust optimization approach. As the demand for high-quality forged components Continues to grow, the Taguchi method remains a valuable tool for researchers and industry professionals seeking to enhance process efficiency and product quality.
This study presents a novel approach to optimizing hot-forging conditions for AISI 1045 medium carbon steel, which is increasingly preferred in the automotive industry due to its balanced mechanical properties, weldability, machinability, and durability. AISI 1045 can be hardened through heat treatment at temperatures ranging from 820 to 850°C and exhibits excellent forgeability within the 850-1250°C range, making it well-suited for large structural components. Widely used in applications such as gears, crankshafts, shafts, axles, and die forgings, the strength and wear resistance of AISI 1045 renders it ideal for enhancing forging processes essential to automotive manufacturing (Chaudhari, Nidre, and Bharsakade, 2024; Equbal et al., 2014; Murugesan and Jung, 2019).
2.1. Chemical composition
The material used in this study was AISI 1045 steel, a medium-carbon steel widely utilized in various industries, particularly in the automotive and machinery sectors. Table 1 details the chemical composition of AISI 1045 steel in accordance with standard specifications. Table 2 compares its international grades, highlighting equivalents in the AISI, DIN, JIS, GB, and BS standards. To validate these specifications, chemical composition analysis was performed on two specimens using an optical emission spectrometer. The results, summarized in Table 3, confirm the presence of key elements such as carbon (C), nickel (Ni), chromium (Cr), and molybdenum (Mo) in AISI 1045 steel. The combination and proportion of these elements enhance its high strength, hardenability, and corrosion resistance. The analyzed chemical composition demonstrated compliance with the standard AISI specifications, affirming its conformity to the AISI 1045 steel standards.
Table 1 Chemical composition of the AISI 1045 steel (AISI standard)
Table 2 International grades of AISI 1045 steel
Table 3 Chemical composition testing results for AISI 1045 steel
2.2. Mechanical properties
Mechanical properties of AISI 1045 steel were investigated through thermal compression experiments using a Baehr DIL-805 deformation dilatometer to investigate the mechanical properties of AISI 1045 steel. For the experimental setup, twelve cylindrical samples, each with a diameter of 5 mm and a height of 10 mm, were prepared using a laser cutting tool. The deformation temperature was directly monitored by attaching a thermocouple to the surface of each sample. The experiments were conducted at four deformation temperatures (900°C, 1000°C, 1100°C, and 1200°C) and three strain rates (0.1 s-1, 1 s-1, and 10 s-1). Each sample was placed in a vacuum chamber filled with argon gas to prevent oxidation. Heating was performed using an induction coil at a controlled rate of 1.625°C per second until the target temperature was reached. To achieve thermal equilibrium the samples were held at the target temperature for 1 minute to ensure uniform temperature distribution. The deformation process consisted of compressing to a height reduction of 60% using an Alumina punch, immediately quenched in argon gas, and cooled at 40°C per second to room temperature. The deformation route of the hot compression experiment is depicted in Figure 1(a). Flow stress  data, derived from the hot compression tests and represented as functions of strain
  and temperature (T), were integrated into the FEM simulation software. Representative flow curves for various deformation conditions are shown in Figures 1(b) and 1(c). Table 4 summarizes the mechanical properties of AISI 1045 medium carbon steel, including its density, modulus of elasticity, ultimate tensile strength, yield strength, Poisson's ratio, and Brinell hardness. These properties provide critical insights into the material’s characteristics under different forging conditions and are essential inputs for simulations and analyses.
Table 4 Mechanical properties of the AISI 1045 medium carbon steel.

Figure 1 (a) Schematic diagram of hot compression tests and examples of flow stress curves for AISI 1045 medium carbon steel varying conditions at a strain rate of (b) 1 s-1, and temperature of (c) 1100°C.
2.3. Microstructure characterization
The validation of FEM simulation results was accomplished through grain size and phase analysis. The cut sample was mounted using a hot mounting press, and the cutting surfaces were polished in stages. Initial polishing was performed using 400-grit SiC abrasive paper, followed by sequential polishing with 600, 800, 1000, and 1200-grit SiC papers. Final polishing used 0.3 µm alumina particles to achieve a smooth surface. After polishing, the surfaces were etched for 4 s using 4% picral solution and 3% Nital solution to reveal the microstructure. Microstructural observations were conducted using Light Optical Microscopy (LOM). The initial microstructure of the AISI 1045 medium carbon steel was composed of proeutectoid ferrite and pearlite, as shown in Figure 2. To determine the average grain size, the Metallographic method was applied following the ASTM E1382 standard.

Figure 2 Initial Microstructure of AISI 1045 medium carbon steel, as observed through OM at a magnification of 200x, depicting proeutectoid ferrite and pearlite structures.
2.4. Microstructure Evolution Model
In hot forging, dynamic recrystallization (DRX) initiates due to the accumulation of dislocations resulting from plastic deformation. DRX begins when the dislocation density surpasses a critical threshold, referred to as the critical strain  for DRX (Wu et al., 2018). Various studies have attempted to predict the critical strain. Wang et al. (2021) observed that the stress peak in the flow curve at a constant strain rate corresponds to an inflection point in the strain hardening rate
  versus stress
  plots. Building upon this observation, Poliak and Jonas (2003) demonstrated that this inflection point indicates the onset of an additional thermodynamic degree of freedom in the system, which marks the initiation of DRX. To enhance analytical efficiency, Mirzadeh and Najafizadeh (2010), and Najafizadeh and Jonas (2006) refined Poliak and Jonas’s approach by fitting a third-order polynomial equation to the
  curves. Using this method, the normalized critical strain can be expressed as the following ratio:
  is derived by incorporating parameters such as the initial grain size
  temperature (T), strain rate
  and the activation energy for deformation (Q) (Chen et al., 2022; Wang et al., 2011). These relationships are further elaborated in Equation 1.
(1)
This study utilizes a computational approach to predict the microstructure evolution of forged components, with DRX kinetics serving as a key aspect of the analysis. The widely adopted JMAK equation underpins the modeling of DRX kinetics. The validity and reliability of this equation have been extensively demonstrated in numerous studies (Zhang et al., 2022a; 2022b; Joun et al., 2022; Ji et al., 2021; Zhang et al., 2020a; Ji et al., 2020; Zhang et al., 2019; Marques Ivaniski et al., 2019).
(2)
Equation 2 defines the evolution of the DRX volume fraction as a function of strain. The strain required to achieve a 50% DRX volume fraction, as determined by Equation 3, is derived from the correlations established in the existing literature.
(3)
The average DRX grain size is defined as
(4)
The microstructural evolution during DRX is mathematically represented by Equations 1-4, which incorporate coefficients derived from experimental data. In this study, the coefficients specific to AISI 1045 medium carbon steel are presented in Table 5, as reported by Siripath et al. (2024). Their research on the DRX characteristics and microstructure evolution of AISI 1045 medium carbon steel under high temperatures and varying strain rates established a strong correlation between the simulation results and experimental observations, validating the accuracy of the developed models. Using these equations, a FEM model was integrated into the finite element software to predict the microstructure evolution in the forged components, with a particular focus on ball joints.
Table 5 Coefficients of the microstructure equations for the investigated steel.
2.5. Experiment design
The Taguchi method, developed by Dr. Genichi Taguchi at Japan's Electronic Control Laboratory in the late 1940s, is a standardized Design of Experiments (DOE) technique that enables the simultaneous analysis of multiple variables to identify optimal outcomes. This approach offers a robust and efficient means of examining the intricate relationships between process parameters while streamlining production processes to improve operational efficiency. As a cost-effective method, the Taguchi method reduces the required specimens and the time needed for investigations without compromising accuracy (Budiyantoro et al., 2024). The Taguchi method uses two essential tools: an orthogonal array (OA) for structuring experimental runs and the signal-to-noise (S/N) ratio for assessing performance quality. The OA is constructed based on the control factors (design parameters) and their respective levels. The S/N ratio is calculated using performance characteristics to quantify variations, with a higher S/N ratio indicating better quality performance, where noise represents variance. The S/N ratios are categorized into three types based on optimization goals: “lower is better” (LB), “nominal is best” (NB), and “higher is better” (HB) (Khentout, 2019; Sudeesh, 2018; Kumar, 2012; Wu and Chang, 2004)
The most critical stage of the Taguchi method is selecting the appropriate control factors. In this study on forging, three key control factors were identified: initial billet temperature, billet length, and friction factor (as outlined in Table 6). To structure the experiment, an L9 orthogonal array, outlined in Table 7, was used, allowing for a set of nine simulations incorporating three levels for each of the three factors. The simulations were designed and analyzed using MINITAB 19.2 software. For this study, the "LB" S/N ratio was chosen because minimizing the forging loads and maximum stresses is a key objective. The S/N ratio was calculated using Equation 5, where n represents the number of trials and yi denotes the value of the i-th observation.
(5)
Table 6 Control factors and their levels.
In industrial practice, billets are typically heated to around 1100 °C, consistent with the findings of Murugesan and Jung (2019), which highlight that optimal forgeability of AISI 1045 medium carbon steel occurs within the temperature range of 850 °C to 1250 °C. Regarding billet length, the standard industrial practice employs a length of 160 cm. However, to enhance practicality and reduce initial billet volume, shorter lengths of 160 mm, 157 mm, and 153 mm were evaluated in this study. Research by Soranansri et al. (2021) demonstrates that optimizing billet size significantly improves metal flow into the die cavity, reduces material waste, and enhances cost efficiency. Similarly, Siripath et al. (2023b) identified 153 mm as the optimal billet length for hot closed-die forging of ball joints using FEM analysis across five tested sizes. This length achieved effective die filling without defects, improving manufacturing efficiency and minimizing material waste, although temperature and lubrication effects were not assessed in their study. The friction factor, a critical variable in the forging process, was also investigated. Poungprasert et al. (2024) determined friction factors under varying lubrication conditions: 0.64 for dry conditions, 0.50 for water with black graphite, and 0.15 for oil with black graphite. These values were derived from hot-ring compression tests on AISI 1045 medium carbon steel and validated through FEM-based predictive calibration curves that monitored changes in the sample height and internal diameter during compression. These findings are directly relevant to ball joint production. By carefully selecting these control factors of initial billet temperature, billet length, and friction factor, this study ensures a comprehensive understanding of their impact on the forging process, thereby justifying their inclusion in this study.
2.6. FE Simulation of Ball Joints
In this study, a ball joint was manufactured using a hot-forging process. The procedure began by heating the billet in an induction furnace, followed by transferring the heated billet to a mechanical press in a forging station. The hot forging process consisted of three primary stages: preforming, finishing, and flash-trimming. During the performing stage, the billet was shaped to distribute the mass and form an approximation of the desired shape. The finishing stage refined the part to achieve precise geometrical and dimensional accuracy. Finally, the flash-trimming operation removed the excess material from the forged part. After the finishing stage, the flash was trimmed, and the workpiece was cooled to ambient temperature. The upper and lower dies used in the forging process were made of SKD61 steel. The preforming die surface was designed to be approximately 1 mm deeper than the finishing die surface, and the die gap between the upper and lower dies was maintained at 3 mm for both preforming and finishing operations. A Crank press JFP-1350 M/C, a 1350-ton mechanical press with a total stroke of 240 mm and an operating speed of 85 strokes per minute, was used to forge the ball joint. To simulate the ball joint manufacturing process, a 3D-CAD model was developed to represent the entire hot forging process, including the upper die, lower die, and billet. The 3D-CAD model was imported into the FEM simulation software for analysis. The FEM model employed tetrahedral elements, with remeshing applied during the numerical solution phase to accommodate significant plastic deformation within the elements. The flow stress-strain and microstructure evolution models were integrated into the FEM simulation software. The simulation conditions were designed to closely replicate the actual hot forging process. The cylindrical billet was designated as a deformable body, while the upper and lower dies were designated as rigid bodies. Ambient heat transfer coefficients were applied based on the recommended values in the software library.
3.1. Taguchi’s experimental design
To optimize the forging conditions, three key parameters—friction factors, billet length, and billet temperature—were analyzed in finite element (FEM) simulations. The maximum forging loads (comprising preforming and finishing loads) and the maximum stress were recorded for each FEM simulation trial. These values served as inputs for calculating the signal-to-noise (S/N) ratios for both the forging loads and the maximum stress using Taguchi response analysis. The results are summarized in Table 7.
According to the Taguchi method, a higher S/N ratio indicates better quality, indicating optimal conditions can be achieved by selecting the parameter combination with the highest S/N ratio. In this study, the S/N ratio analysis focused on three quality characteristics: maximum forging loads (including preforming and finishing loads) and maximum stress. A "smaller-the-better" criterion was applied because very high stresses and forging pressures can have adverse effects. Excessive stresses may lead to undesirable deformations or defects in the forged product, while elevated forging pressures can damage the dies. Based on the S/N ratio analysis presented in Table 8, the optimal control factor levels were identified for both maximum forging loads and maximum stress parameters. Figure 3 illustrates the relationships between the control factors and their S/N ratio. The optimal forging conditions were determined to be a billet temperature of 1200°C, a billet length of 153 mm, and a friction factor of 0.15. These levels exhibited the highest S/N ratio among all other levels.
Table 7 Simulation results for maximum forging loads (ton-force, tf) and maximum stresses (MPa).
Table 8 S/N response table for maximum loads and maximum stresses.

Figure 3 Main effect plot of control parameters on the S/N ratio: (a) Maximum preforming loads, (b) Maximum finishing loads, and (c) Maximum Stresses
However, closer examination of the friction factor data for maximum stress revealed a potential anomaly. The S/N ratio for the friction factor remained identical across all three levels at maximum stress. This issue could be attributed to either a data error or the possibility that, within the range studied, the friction factor had a negligible effect on the maximum stress. To validate these findings and assess the significance of each control factor, further analysis using Analysis of Variance (ANOVA) was conducted for both maximum forging loads and maximum stress.
3.2. ANOVA
The ANOVA results presented in Table 9 evaluate the influence of three factors (billet temperature (°C), billet length (mm), and friction factor) on three distinct responses: maximum preforming load, maximum finishing load, and maximum stress. Each factor’s impact was analyzed based on its percentage contribution to variability, F-value, and corresponding P-value, offering a comprehensive understanding of its statistical significance. The percentage contribution to variability reflects the proportion of the total variation in each response attributable to a specific factor, facilitating the identification of the most influential variables. The F-value, calculated as the ratio of between-group variance to within-group variance, indicates the relative significance of each factor, with higher F-values indicating more substantial differences between group variances. The observed P-values were all less than 0.05, indicating a statistically significant relationship between the factors and the responses (Muhammad Sayuti, 2022; Zhang et al., 2020b; Montgomery, 2010).
Table 9 Results of ANOVA for maximum forging loads and maximum stresses.
The ANOVA results indicate that billet temperature and friction factor significantly affect the maximum preforming load response. Billet temperature contributes 46.03% to variability with a low P-value of 0.014, demonstrating its statistically significant impact. Similarly, the friction factor accounts for 50.78% of the variability, with a low P-value of 0.013, reinforcing its considerable influence. In contrast, billet length had a minor effect, contributing only 2.53% of the variability, with a higher P-value of 0.206, suggesting its impact may not be statistically significant. For the maximum finishing load response, the billet temperature and friction factor again emerged as important contributors. Billet temperature accounts for 69.07% of the variability, with a P-value of 0.01, indicating a strong influence. The friction factor contributes 29.12% to the variability, with a P-value of 0.023, confirming its significant impact. In contrast, billet length has a negligible effect, contributing only 1.12% to the variability, with a higher P-value of 0.381. For maximum stress, billet temperature emerges as a highly significant factor, accounting for 89.13% of the variability. However, its P-value of 0.074, which was moderately high, suggests that additional investigation may be necessary to confirm its significance. Both billet length and friction factor exhibited minimal effects on maximum stress, with relatively high P-values indicating non-significance. In summary, the ANOVA results underscore the critical importance of billet temperature and friction factor in determining maximum preforming and finishing loads. Additionally, they suggest a possible, although less certain, effect of billet temperature on the maximum stress.
3.3. Linear Regression Analysis
This study examined the relationship between dependent and independent variables through regression analysis. The dependent variables included the maximum preforming load, maximum finishing load, and maximum stress, while the independent variables comprised billet temperature (Tb), billet length (lb), and friction factor at the die and workpiece interface (m). The predictive equations derived from the linear regression analysis for the maximum forging loads and maximum stress are provided in Equations (6)–(8) below:
Maximum preforming load (tf) = 1058 - 1.544 Tb + 6.53 lb + 612.9m (6)
Maximum finishing load (tf) = 1376 - 1.5273 Tb + 4.57 lb + 374.4m (7)
Maximum Stress (MPa) = 233.2 - 0.1274 Tb + 0.651 lb - 1.56m (8)

Figure 4 Comparison of (a) the maximum preforming load, (b) the maximum finishing load, and (c) the maximum effective stresses from the simulation against predictions made by the linear regression model
The plots illustrating the maximum preforming load and maximum finishing load, simulated and predicted by regression Equations 6 and 7, are shown in Figures 4(a) and 4(b), respectively. The regression analysis produced average absolute relative errors (AARE) of 4.6118% and 2.78723%, with Coefficient of Determination (R2) of 0.978 and 0.988 for maximum preforming and finishing loads, respectively. The root mean square error (RMSE) values were 31.0974 tf and 18.6350 tf. Similarly, Figure 4(c) shows the maximum stress, which was both simulated and predicted by using regression Equation 8. This analysis yielded an AARE of 1.57423%, an R2 value of 0.909, and an RMSE of 3.79452 tf. The AARE, expressed as a percentage, was a key metric for assessing the model’s overall prediction accuracy, offering a comprehensive assessment of its performance. The R2 values, approaching 1, indicate a strong correlation between the predicted and simulated values, affirming the reliability of the regression model. Additionally, the RMSE values highlight the accuracy of the predictions, with lower values reflecting a closer match between predicted and simulated data points (Siripath et al., 2023a; Chen et al., 2021; Gabb et al., 2005). In Figure 4, the blue dashed lines represent the 95% confidence interval (CI), and the purple dashed line denotes the 95% prediction interval (PI).
3.4. Verification results of the FEM
The Taguchi method was used to determine the optimal forging conditions, which were found to be an initial temperature of 1200°C, a billet length of 153 mm, and a friction factor of 0.15. These conditions were subsequently implemented in the simulation software and verified through shop floor experiments for ball joint manufacturing. The FEM simulation mesh details for the ball joint, including the discretization level and element numbers used to represent the geometry and behavior of the initial billet, were as follows: the initial model contained 2093 nodes, 2640 surface elements, and 8532 volumetric elements. Remeshing was required during the numerical solution due to significant plastic deformation. After the preforming process, the workpiece included 72,474 nodes, 75,358 surface elements, and 331,745 volumetric elements. After the finishing process, these numbers changed to 80,728 nodes, 80,654 surface elements, and 374,564 volumetric elements.
During the experimental trials, the material filled the die cavity without any observable defects in the workpiece, confirming that the forming conditions were successful. Figure 5(a) presents a direct comparison of the ball joint geometry, showcasing the smooth, gray-colored simulation model alongside the actual manufactured component, which exhibits the typical metallic surface finish and texture found in forged parts. The simulated and manufactured parts displayed identical geometric features, including the spherical socket and extended arm with circular indentations. The close alignment between the predicted and actual results validates the reliability of the simulation in accurately predicting the final shape of the manufactured ball joint.

Figure 5 The final shape of ball joint: (a) simulation and (b) actual object; (c) Bar graph comparing forging loads between experimental data, predictive equation, and FEM simulation.

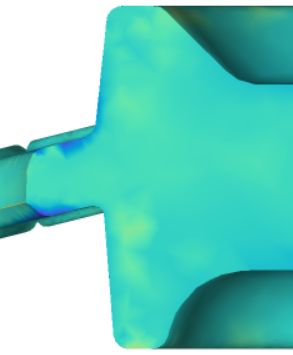
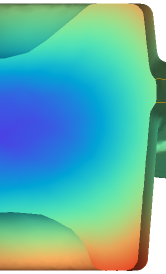
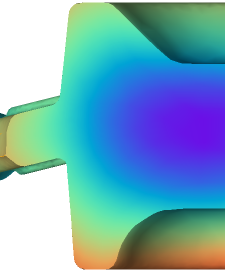
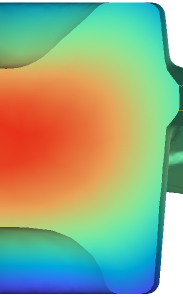
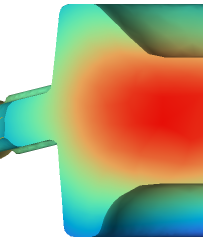
Figure 6 (a) Distance to contact; (b) Effective stress distribution; (c) Plastic strain; and (d) Temperature distribution after preforming and finishing processes.
To further analyze the mechanics of the forging process, the FEM results illustrated in Figure 6 provides detailed insights into various parameters tracked during the preforming and finishing phases. These parameters included the distance to contact, effective stress distribution, accumulated plastic strain, and temperature distribution across the forged part. In Figure 6(a), the contour colors represent the distance between the dies and the outer surface of the workpiece, which is measured perpendicular to the forging die. Minimal distances indicate areas where the die was nearly or fully in contact with the workpiece, reflecting the progression of material deformation during forging. Conversely, larger distances highlight regions that have not fully conformed to the die shape, suggesting incomplete cavity filling or areas that require additional deformation. These contact conditions directly influenced the stress distribution shown in Figure 6(b), which illustrates the effective stress within the workpiece during the FEM simulations. Peak stress concentrations were observed near the workpiece periphery, especially in regions where flashes were formed. High-stress zones formed at the points where the workpiece made contact with the curved fillet sections of the die cavity. These zones became more pronounced during the finishing stage as the forming loads reached their peak. The resulting material deformation was reflected in the FEM plastic strain distribution, as shown in Figure 6(c), which revealed optimal strain patterns throughout the forming process. The simulation indicated that the highest strain levels (up to 13.5) were concentrated in the flash regions, which are sacrificial and intended to be trimmed. Meanwhile, the main workpiece experienced moderate-to-low strain levels. Notably, critical functional areas, such as circular cavities, maintained minimal strain. The transition from the preforming to the finishing stages demonstrated controlled material flow and balanced forming conditions, confirming the effectiveness of the die design in producing high-quality parts. This plastic deformation generates heat, as shown in the FEM temperature distribution analysis (Figure 6(d)). In this analysis, higher temperatures (1050-1200°C) were observed in the outer edges and flash areas, whereas moderate temperatures (600-750°C) persisted in the central and cavity regions. The transition from preforming to finishing stages resulted in a more uniform heat distribution, indicating effective thermal management throughout the forming process. This management was crucial for ensuring optimal material flow and product quality.
To validate the accuracy of the FEM simulation, a comparative analysis was conducted between the experimental data, FEM simulation, and predictive calculations regarding the maximum forging loads for both the preforming and finishing stages, as shown in Figure 5(b). The mechanical press measurements indicated peak loads of 350.2 tf during preforming and 325.4 tf during finishing. The FEM simulation showed lower values, with 276 tf during preforming and 300.3 tf during finishing, whereas the predictive model estimated loads at 296.23 tf and 298.61 tf, respectively. Compared with the experimental data, the FEM simulations exhibited error rates of 21.19% during preforming and 7.71% during finishing. Similarly, the predictive model showed discrepancies of 15.41% and 8.23% for the respective stages. These results provide key insights into the computational predictions. Both computational methods consistently underestimated the experimental loads and achieved better accuracy during the finishing stage. The predictive model demonstrated a more consistent performance across both stages, whereas the FEM simulation exhibited notable improvement from preforming to finishing. The lower error rates in the finishing stage (below 10% for both methods) suggest that the computational models more accurately reflect the forming mechanics in the final deformation phase. These findings indicate that although both approaches offer reasonable predictions, further refinement is necessary to enhance their accuracy, particularly during the preforming stage, where material behavior and friction conditions may be more complex.
The literature review on optimizing process parameters included several notable studies that confirmed the optimal conditions identified through the Taguchi method in this study. Siripath et al. (2023b) utilized simulation software to optimize the initial billet size and predict the forging load for ball joints, ensuring consistent processing conditions. Their FEM analysis reduced the billet mass, cost, and material waste. Despite an average prediction error of 7.31% for the forging load, their finite element simulation was instrumental in reducing costs and enhancing the process. The optimal size identified (48 mm diameter, 153 mm length) ensured defect-free workpieces and yielded material savings of up to 17.65%. On another note, Poungprasert et al. (2024) examined the effects of lubrication on friction during hot-ring compression tests of AISI 1045 medium carbon steel. Their FEM simulation results closely matched the experimental data, indicating that oil mixed with black graphite is the most effective lubricant.
In this study, a microstructure evolution model was used to simulate the forging process of ball joints. This approach builds upon the work of Siripath et al. (2024), who assessed the reliability of a microstructure evolution model (as outlined in Section 2.4) for AISI 1045 medium carbon steel using FEM simulation during their hot compression tests. The FEM simulation analysis in this study focused on three critical aspects of the ball joint after cooling to room temperature: grain size distribution, pearlite volume fraction (%) distribution, and tensile strength distribution, as illustrated in Figure 7. For validation purposes, a cross-section of the ball joint was prepared for microstructure observation at 11 designated study points, as shown in Figure 8. Table 10 summarizes the distributions of grain size, pearlite volume fraction, and ferrite volume fraction at these points after forging, as determined by FEM simulation.
The FEM simulation provided detailed insights into the microstructural and mechanical properties of the forged ball joint component, particularly in terms of grain size evolution. The results revealed significant variations in grain size distribution across the components, with sizes ranging from a minimum of 5.1009  to a maximum of 41.2166 . The mean grain size was recorded at 23.4056 with a standard deviation of 2.103 . The distribution histogram showed a predominantly normal distribution pattern, with most grain sizes clustering between 20-25 . The experimental metallographic analysis conducted across the 11 designated study points yielded an average experimental grain size of 20.423 with a standard deviation of 6.8140 . Comparisons between the simulated and experimental results revealed a mean deviation of 15.507%, with point-to-point variations ranging from 3.541% to 9.334%, indicating a strong correlation between the FEM model predictions and actual microstructural observations. The spatial distribution map shows that the central regions of the ball joint have more uniform grain structures. In contrast, the slight variations observed near the edges and geometric transitions are likely the result of different cooling rates and deformation patterns during the forging process. Recent studies by Hu and Wang (2020) have provided crucial insights into the grain size variations observed in this study. Their investigation into 5CrNiMoV steel showed that DRX behavior is strongly influenced by processing parameters, with higher temperatures and lower strain rates facilitating an increased DRX volume fraction. These results correlate with our observations of more uniform grain structures in the central regions of the ball joint. Hu et al. (2020) also explored the effects of multi-directional non-isothermal forging. They discovered that complete DRX results in more uniform and equiaxed grains, which mirrors the grain size distribution patterns observed in this study. Their research further identified discontinuous dynamic recrystallization (DDRX) as the primary mechanism for nucleation and grain growth, which explains the grain refinement patterns observed in this study, particularly in areas subjected to varying cooling rates.

Figure 7 FEM simulation results for the forged part: (a) grain size distribution ( ), (b) pearlite volume fraction (%) distribution, and (c) tensile strength distribution.

Figure 8 Cross-section of the actual ball joint, already mounted for microstructure observation, with marked study points.
Table 10 Distribution of grain size, pearlite volume fraction, and ferrite volume fraction after forging process at 11 study points based on FEM simulation.


Building on the microstructural analysis, the phase transformation behavior was examined using the material library of the FEM simulation software to model the cooling process down to room temperature. Based on the Continuous Cooling Transformation (CCT) diagram, it was determined that the structure of the ball joint transitioned to pearlite during the cooling phase. This transformation is evidenced by the microstructure depicted in Figure 9, which shows a mix of proeutectoid ferrite and pearlite. The FEM simulation results regarding the pearlite volume fraction after cooling are displayed in Figure 7(b). Validation through comparisons with the measured volume fractions at the 11 designated study points, as shown in Figure 10(b), confirmed high accuracy with a minor error of only 5.33%. Further understanding of phase transformation predictions is supported by recent advancements in transformation modeling. Poloczek et al. (2020) indicated that the deformation process significantly affects the developed austenite microstructure, subsequently affecting the kinetics of phase transformations. Their findings emphasize that incorporating austenite grain size as an independent variable in transformation models substantially enhances prediction accuracy. Additionally, research by Zhang et al. (2020a) on DRX behavior indicated that the maximum values of effective strain and DRX volume fraction are typically concentrated in the central section of the forged components, which is consistent with the observed uniform phase distribution patterns in this study. Their model, which achieved correlation coefficients of 0.973 and 0.994 for DRX grain size and volume fraction, respectively, sets a benchmark for our achieved accuracy levels.

Figure 9 Microstructures in studied points of the ball joint cross-section.

Figure 10 Bar graph comparing simulation and measured results for (a) grain size and (b) pearlite volume fraction of the ball joint after cooling to room temperature at the study points
The microstructural evolution directly influenced the mechanical properties, as demonstrated by the tensile strength distribution analysis in Figure 7(c). The simulation results revealed a relatively uniform strength profile throughout the forged component, with tensile strength values ranging from 642.04 to 642.122 MPa and an average of 642.07 MPa. The distribution histogram exhibited a slightly skewed pattern, with most values concentrated between 642.06 - 642.10 MPa. This narrow range of tensile strength values correlated strongly with the uniform phase distribution and controlled cooling conditions identified in the microstructural analysis. The consistency in the tensile strength distribution (642.04 - 642.122 MPa) aligns with recent findings on process-property relationships. Hu et al. (2020) demonstrated that the formation of high-angle grain boundaries during complete DRX reduces defects and promotes uniform mechanical properties. Their study showed that favorable grain orientations for slip systems develop during hot deformation, supporting the observed uniform strength profile. (Zhang et al., 2020a) also highlighted that the relationship between processing parameters and mechanical properties can be effectively predicted using integrated modeling approaches, achieving average absolute relative errors as low as 3.2% in microstructural predictions.
These comprehensive results highlight the effectiveness of the microstructure evolution model in predicting the grain size distribution, phase transformations, and mechanical properties in forged ball joints. However, further refinement of the model could enhance the prediction accuracy.
This study successfully optimized the forging conditions for manufacturing ball joints using AISI 1045 medium carbon steel by integrating the Taguchi method, FEM simulations, and regression analyses. The optimal parameters identified were a billet temperature of 1200°C, a billet length of 153 mm, and a friction factor of 0.15. ANOVA results highlighted billet temperature and friction factor as the most influential parameters, collectively explaining over 96% of the variation in forging loads. The linear regression models demonstrated high predictive accuracy, achieving R² values of 0.978 and 0.988 for preforming and finishing loads, and an R² of 0.909 for maximum stress, with low relative errors, confirming their reliability. FEM simulations incorporating the JMAK model accurately predicted microstructural evolution, including grain sizes ranging from 5.10 to 41.22 , with a mean deviation of 15.51% from experimental measurements. Additionally, the simulation effectively predicted pearlite phase transformation with a minor error of 5.33% and tensile strength distribution ranging from 642.04 to 642.12 MPa with high accuracy. Experimental validation confirmed successful die cavity filling without defects, with reasonable agreement between experimental and simulated results. The FEM simulations exhibited error rates of 21.19% and 7.71% for preforming and finishing loads, respectively, while predictive models showed lower discrepancies of 15.41% and 8.23%, demonstrating improved accuracy, particularly during the finishing stage. This integrated approach of optimization, FEM simulation, and microstructural analysis establishes a robust framework for enhancing efficiency and minimizing material waste while ensuring consistent product quality. It offers significant advantages for industrial applications, particularly in automotive manufacturing, by reducing reliance on trial-and-error approaches and lowering production costs. The successful implementation of this methodology provides a reliable foundation for improving the efficiency and quality of ball joint production.
This work was financially supported by the Petchra Pra Jom Klao PhD. Research Scholarship (KMUTT-NSTDA) from King Mongkut's University of Technology Thonburi. The authors gratefully acknowledge the additional support provided by the National Research Council of Thailand (NRCT) under grant NRCT5-RRI63006-P08. Finally, the authors extend their sincere thanks to "S.B. - CERA Co., Ltd." for their invaluable contributions to material testing and experimental work.
Al-Arifi, N., Zamani, A., Khan, J. 2011., Billet Optimization for Steering Knuckle Using Taguchi Methodology. International Journal of Computer Theory and Engineering, Volume Volume 3(4), pp. 552–556. doi:10.7763/IJCTE.2011.V3.368
Altan, T. 2005., Cold and Hot Forging: Fundamentals and Applications. Materials Park, Ohio, ASM International. doi:10.31399/asm.tb.chffa.9781627083003
Budiyantoro, C., Rochardjo, H.S.B., Wicaksono, S.E., Ad, M.A., Saputra, I.N., Alif, R., 2024. 2024. Impact and Tensile Properties of Injection-Molded Glass Fiber Reinforced Polyamide 6 –Processing Temperature and Pressure Optimization. International Journal of Technology, Volume 15(3), pp. 597–607. doi:10.14716/ijtech.v15i3.5404
Byun, H.-S. , Lee, S.-H. 2017., Design of a Piston Forging Process Using A Hybrid Taguchi Method and Multiple Criteria Decision-Making. Journal of Mechanical Science and Technology, Volume 31(4), pp. 1869–1876. doi:10.1007/s12206-017-0334-7
Chaudhari, R., Nidre, P., Bharsakade, R., 2024. Thermo-mechanical Analysis of Upset Forging of AISI 1045 Steel By using Deform 3D. Materials Today: Proceedings, Volume 113, pp. 353–358. doi:10.1016/j.matpr.2024.02.023
Chen, X., Du, Y., Du, K., Lian, T., Liu, B., Li, Z., Zhou, X., 2021. Identification of the Constitutive Model Parameters by Inverse Optimization Method and Characterization of Hot Deformation Behavior for Ultra-Supercritical Rotor Steel. Materials (Basel), Volume 14(8), p. 1958. doi:10.3390/ma14081958
Chen, X., Liu, B., Zhang, B., Sun, J., Yang, Z., Zhou, X., Huang, T., Yin, D., 2022. Modeling of Dynamic Recrystallization Evolution for Cr8 Alloy Steel and Its Application in FEM. Materials, Volume 15(19), p. 6830. doi:10.3390/ma15196830
Debin, S. , Lin, Y. 2014., 5.14 - Hot Forging. In: HASHMI, S., BATALHA, G. F., VAN TYNE, C. J. , YILBAS, B.
(eds.) Comprehensive Materials
Processing. Oxford: Elsevier
Equbal, I., Ohdar, R., Bhat, N.S., Ahmad, S., 2012. Preform Shape
Optimization of Connecting Rod Using Finite Element Method and Taguchi Method.
International Journal of Modern
Engineering Research, Volume 2(6), pp.
4532–4539
Equbal, M.I., Talukdar, P., Kumar, V., Ohdar, R.K. 2014. Deformation Behavior of Micro-alloyed Steel by Using Thermo Mechanical Simulator and Finite Element Method. Procedia Materials Science, Volume 6, pp. 674–681. doi:10.1016/j.mspro.2014.07.083
Gabb, T., Gayda, J., Falsey, J., 2005.
Forging of Advanced Disk Alloy LSHR. National Aeronautics and Space Administration
(NASA)
Harris, J.N., 2014. Mechanical
Working of Metals: Theory and Practice, Elsevier Science
Hu, Z. , Wang, K., 2020. Evolution of Dynamic Recrystallization in 5CrNiMoV Steel during Hot Forming. Advances in Materials Science and Engineering, Volume 2020, p. 4732683. doi:10.1155/2020/4732683
Hu, Z., Wang, K. , Yang, L., 2020. Simulation and Experimental Study on Microstructure Evolution of 5crnimov Steel During Multi-Directional Non-Isothermal Forging. Materials Research Express, Volume 7(12), p. 126516. doi:10.1088/2053-1591/abd2f8
Ji, H., Cai, Z., Pei, W., Huang, X. , Lu, Y., 2020. DRX Behavior and Microstructure Evolution of 33Cr23Ni8Mn3N: Experiment and Finite Element Simulation. Journal of Materials Research and Technology, Volume 9(3), pp. 4340–4355. doi:10.1016/j.jmrt.2020.02.059
Ji, H., Peng, Z., Huang, X., Wang, B., Xiao, W. , Wang, S., 2021. Characterization of the Microstructures and Dynamic Recrystallization Behavior of Ti-6Al-4V Titanium Alloy through Experiments and Simulations. Journal of Materials Engineering and Performance, Volume 30(11), pp. 8257–8275 https://doi.org/10.1007/s11665-021-06044-0. doi:10.1007/s11665-021-06044-0
Joun, M.S., Razali, M.K., Chung, S.H., Irani, M., 2022. A Direct Method of Calculating Flow-Related Dynamic Recrystallization Parameters for Generality and Accuracy in Predicting Microstructural Evolution. Journal of Materials Research and Technology, Volume 18, pp. 3894–3907. doi:10.1016/j.jmrt.2022.04.060
Khentout, A.K., Mohamed, Khochemane, Lakhdar., 2019. Taguchi Optimization and Experimental Investigation of the Penetration Rate of Compact Polycrystalline Diamond Drilling Bits in Calcareous Rocks. International Journal of Technology, Volume 10(2), pp. 291–319. doi:10.14716/ijtech.v10i2.2137
Kumar, V.K., Neelam 2012. Modeling and Multiple Performance Optimization of Ultrasonic Micro-Hole Machining of PCD Using Fuzzy Logic and Taguchi Quality Loss Function. Advances in Materials Research, Volume 1(2), pp. 129–146. doi:10.12989/amr.2012.1.2.129
Marques Ivaniski, T., Hatwig, R., Dong, J., Epp, J., Zoch, H., Da Silva
Rocha, A., Rocha, S., 2019. An
Approach Using JMAK Model in Numerical Simulation to Control of Austenitic
Grain Size in Hot Forging. In: 23rd International Forging
Conference -BrazilAt: Porto Alegre, Brazil
Mirzadeh, H., Najafizadeh, A., 2010a. Extrapolation of Flow Curves at Hot Working Conditions. Materials Science and Engineering: A, Volume 527(7), pp. 1856–1860. doi:10.1016/j.msea.2009.11.013
Montgomery, D.C.R., George C. 2010. Applied
Statistics and Probability for Engineers, John Wiley & Sons
Movrin, D., Plancak, M., Vilotic, D., Milutinovic, M., Skakun, P.,
Luzanin, O., I, T. 2010. Optimization and Design of Multistage Hot Forging
Processes by Numerical Simulation and Experimental Verification. Volume 35,
pp. 75–89
Sulaiman, S., Alajmi, .M.S., Wan Isahak, W.N., Yusuf, M., Sayuti, M., 2022. Dry Milling Machining: Optimization of Cutting Parameters Affecting Surface Roughness of Aluminum 6061 using the Taguchi Method. International Journal of Technology, Volume 13(1), pp. 58–68. doi:10.14716/ijtech.v13i1.4208
Murugesan, M., Jung, D.W., 2019. Two Flow Stress Models for Describing Hot Deformation Behavior of AISI-1045 Medium Carbon Steel at Elevated Temperatures. Heliyon, Volume 5(4), p. e01347. doi:10.1016/j.heliyon.2019.e01347
Najafizadeh, A., Jonas, J., 2006. Predicting the Critical Stress for Initiation of Dynamic Recrystallization. ISIJ International, Volume 46, pp. 1679–1684. doi:10.2355/isijinternational.46.1679
Obiko, J.O., Mwema, F.M., Shangwira, H., 2020. Forging Optimisation Process Using Numerical Simulation and Taguchi Method. SN Applied Sciences, Volume 2(4), p. 713. doi:10.1007/s42452-020-2547-0
Talukdar, P., Ohdar, R.K., Singh, B., Equbal, M.I., 2015. Optimization of Process Parameters in Hot Forging of Medium Carbon Micro-Alloyed Steel. Applied Mechanics and Materials, Volume Vols. 813-814, pp. 563–568. doi:10.4028/www.scientific.net/AMM.813-814.563
Poliak, E., Jonas, J., 2003. Initiation of Dynamic Recrystallization in Constant Strain Rate Hot Deformation. ISIJ International, Volume 43(5), pp. 684–691. doi:10.2355/isijinternational.43.684
Poloczek, L., Rauch, L., Wilkus, M., Bachniak, D., Zalecki, W., Pidvysotsk'yy, V., Kuziak, R. , Pietrzyk, M. 2020. Physical and Numerical Simulations of Closed Die Hot Forging and Heat Treatment of Forged Parts. Materials (Basel), Volume 14(1), p. 15. doi:10.3390/ma14010015
Poungprasert, R., Siripath, N., Suranuntchai, S., 2024. A Comparative Study of Lubrication Performance for Bs 080M46 Medium Carbon Steel Using Ring Compression Test and Finite Element Simulation. Key Engineering Materials, Volume 973, pp. 37–44. doi:10.4028/p-4n5lyD
Rathi, M.G., Jakhade, N.A., 2014. An Optimization of Forging Process
Parameters by using Taguchi Method: An Industrial Case Study. International
Journal of Scientific and Research Publications, Volume 4(6), pp. 1–7
Satyam, K., Srivastava, D.P., Kumar, S., Ohdar, R., 2021. Parametric optimization of hot forging process: a six sigma based approach. E3S Web of Conference, Volume 309, p. 01159. doi:10.1051/e3sconf/202130901159
Schaeffer, L., Brito, A., Geier, M., 2005. Numerical Simulation using Finite Elements to Develop and Optimize Forging Processes. Steel Research International, Volume 76, pp. 199–204. doi:10.1002/srin.200505996
Siripath, N., Suranuntchai, S., Sucharitpwatskul,
S., 2023a. Comparative Study on Material Models for BS 080M46 Medium Carbon
Steel. Engineering and Applied Science
Research, Volume 51(1), pp. 22–33
Siripath, N., Suranuntchai, S., Sucharitpwatskul, S., 2023b. Cylindrical Billet Size Optimization for Hot Closed-Die Forging of the Upper Ball Joint. Key Engineering Materials, Volume 946, pp. 9–14. doi:10.4028/p-0g8f63
Siripath, N., Suranuntchai, S., Sucharitpwatskul, S., 2024. Modeling Dynamic Recrysatallization Kinetics in BS080M46 Medium Carbon Steel: Experimental Verification and Finite Element Simulation. International Journal of Technology, Volume 15(5), 1292–1307. doi:10.14716/ijtech.v15i5.6770
Soranansri, P., Rojhirunsakool, T., Nithipratheep, N., Ngaouwnthong, C., Boonpradit, K., Treevisootand, C., Srithong, W., Chuchuay, P. , Sirivedin, K. 2021. Hot Forging Process Design and Initial Billet Size Optimization for Manufacturing of the Talar Body Prosthesis by Finite Element Modeling. Applied Science and Engineering Progress, Volume 15(1), p. 3936. doi:10.14416/j.asep.2021.01.002
Sudeesh S., Warriar, J., Joy, K., Sajul U., Sreeprasanth M., 2018.
Application of Taguchi Method for Optimization of Process Parameters in Spur Gear Milling Operation. International
Research Journal of Engineering and Technology, Volume 5(05), pp. 3464–3474
Tempelman, E., Shercliff, H., Van Eyben, B.N., 2014. Chapter 6 - Forging of Metals. In: Manufacturing and Design. Boston: Butterworth-Heinemann. doi:10.1016/C2011-0-08438-7
Wang, K.L., Fu, M.W., Lu, S.Q., Li, X. 2011. Study of the Dynamic Recrystallization of Ti–6.5Al–3.5Mo–1.5Zr–0.3Si alloy in ?-forging Process Via Finite Element Method Modeling and Microstructure Characterization. Materials & Design, Volume 32(3), pp. 1283–1291. doi:10.1016/j.matdes.2010.09.033
Wu, D., Chang, M., 2004. Use of Taguchi Method to Develop a Robust Design for the Magnesium Alloy Die Casting Process. Materials Science and Engineering A-Structural Materials Properties Microstructure and Processing, Volume 379, pp. 366–371. doi:10.1016/j.msea.2004.03.006
Zhan, M., Sun, Z., Yang, H., 2014. Modeling of Hot Forging. Comprehensive Materials Processing, Volume 5, pp. 441–493. doi:10.1016/B978-0-08-096532-1.00529-X
Zhang, K., Wang, K., Lu, S., Liu, M., Zhong, P., Tian, Y., 2022a. Dynamic Recrystallization Behavior and Numerical Simulation of S280 Ultra-High Strength Stainless Steel. Journal of Materials Research and Technology, Volume 20, pp. 4419–4431. doi:10.1016/j.jmrt.2022.09.013
Zhang, S., Fan, S., Dong, P., Cao, Y., Zhao, S., 2020b. The Importance of Forming Parameters on Rolling Process and the Performances of Component in Forming Long Threads. Proceedings of the Institution of Mechanical Engineers, Part E: Journal of Process Mechanical Engineering, Volume 234(1), pp. 29–36. doi:10.1177/095440891987982
Zhang, T., Sha, H., Li, L., Lu, S., Gong, H., 2019. Dynamic recrystallization kinetics and microstructure evolution of 7055 aluminum alloy during hot compression. Metallurgical Research & Technology, Volume 116, p. 605. doi:10.1051/metal/2019034
Zhang, W., Yang, Q., Tan, Y., Ma, M., Xiang, S., Zhao, F., 2020a. Simulation and Experimental Study of Dynamical Recrystallization Kinetics of TB8 Titanium Alloys. Materials, Volume 13(19), p. 4429. doi:10.3390/ma13194429
Zhang, Y.Q., Quan, G.Z., Lei, S., Zhao, J., Xiong, W., 2022b. Description of Dynamic Recrystallization Behaviors and Grain Evolution Mechanisms during the Hot Forming Process for SAE 5137H Steel. Materials (Basel), Volume 15(16), p. 5593. doi: 10.3390/ma15165593