Design and Analysis of Floater Structures using Composite Material in 19 Seaters Aircraft
Corresponding email: andi005@brin.go.id
Published at : 31 Jan 2025
Volume : IJtech
Vol 16, No 1 (2025)
DOI : https://doi.org/10.14716/ijtech.v16i1.6326
Kadir, AM, Setyawan, A, Purnamasari, FN, Pramana, N, Muhammad, Satriya, IAA, Wirawan, R & Sampurno, B 2025, 'Design and analysis of floater structures using composite material in 19 seaters aircraft', International Journal of Technology, vol. 16, no. 1, pp. 112-123
| Andi Muhdiar Kadir | Research Center for Structural Strength of Technology, National Research and Innovation Agency, KST B.J. Habibie, Setu, Tangerang Selatan, Banten 15314, Indonesia |
| Arief Setyawan | Research Center for Structural Strength of Technology, National Research and Innovation Agency, KST B.J. Habibie, Setu, Tangerang Selatan, Banten 15314, Indonesia |
| Fithri Nur Purnamasari | Research Center for Process and Manufacturing Industry Technology, National Research and Innovation Agency, KST B.J. Habibie, Setu, Tangerang Selatan, Banten 15314, Indonesia |
| Nurhadi Pramana | Research Center for Computing, National Research and Innovation Agency, KST Ir. Soekarno, Cibinong, Bogor, Jawa Barat, Indonesia, 16911, Indonesia |
| Muhammad | Research Center for Transportations Technology, National Research and Innovation Agency, KST B.J. Habibie, Setu, Tangerang Selatan, Banten 15314, Indonesia |
| Ilham Akbar Adi Satriya | Research Center for Aeronautics Technology, National Research and Innovation Agency, KS Jacob Salatun, Rumpin, Bogor, Jawa Barat, 16350, Indonesia |
| Riza Wirawan | Faculty of Mechanical and Aerospace Engineering, Institut Teknologi Bandung, Jalan Ganesa No. 10, Kota Bandung, Jawa Barat, 40132, Indonesia |
| Budi Sampurno | PT Dirgantara Indonesia (Indonesian-aircraft Industries), Jalan Pajajaran No. 154, Kota Bandung, Jawa Barat, 40174, Indonesia |

One of the government's programs for connecting cities and remote Indonesian islands were quickly utilized by amphibious aircraft. This was realized with the amphibious N219 program started in 2018. The N219, referred to for Nusantara, its twin engines, and 19-passenger capacity, represents Indonesia's ambition to link its extensive archipelago through innovation and pride. The N219 amphibious aircraft was developed based on the N219 basic aircraft (maximum take-off weight, MTOW 7030 kg), with the incorporation of two floats, enabling it to land on both land and water surfaces. It was intended that the addition of this float would not significantly change the performance of the N219 aircraft, so there was no need to make big changes in terms of the number of passengers. one of the important factors in this performance was the weight penalty. In this research, structural analysis was done to reduce the weight of floaters by applying the optimal design dan used the sandwich composite materials. The specimens of carbon composite were produced by Vacuum-Assisted Resin Infusion/ VARI. The specimens with five fiber orientation variations (UD: 0o, 90o, and 45o and Fabric: ±45o and 0o/90o) were tested, and the results were utilized as data input for finite element analysis. Floater structure modeling was conducted to predict its strength and weight. The modeling analysis results showed that the maximum stress was 354.2 MPa < 1014 MPa (material test result). Meanwhile, the Tsai-wu criteria were 0.550, where it's <1, and the mass of the floater found was 274 kg, where it's <400 kg. It could be seen that the floater structure design using carbon composite materials had good results, so it could be considered for implementation.
Amphibious aircraft; Carbon composite materials; Floater; Tensile strength; Vacuum assisted resin infusion
Background
Some of the research activities about aircraft amphibious as a theory related to the analysis of amphibious aircraft landings, studies regarding the effects of water impact, numerical methods, and experimental tests by dropping objects vertically have been done (Piovesan, 2017; Bendarkar et al., 2013; Canamar, 2012; von Karman, 1929). The novel concept of seaplane floater has also been proposed to increase the operational performance (Aaronsaengmanee and Nontakaew, 2020; Canamar and Smrcek, 2011). Floatplane type seaplane was a land plane with landing gear removed and replaced with a pontoon (two floaters) which functions as a buoy by placing the fuselage in a position above the water's surface (Gudmundsson, 2013). The impact load is one of the important factors to know because, at the time of landing, a large energy absorption process occurs from the surface of the water to the surface of the float. The critical loads or even structural damage can be caused by the impact between the water and the basic structure of the ship (Yanuar et al., 2020; Lv and Grenestedt, 2015).
Fiber-reinforced polymer composites have been used in aviation as a building material for various structural and non-structural aircraft components. Carbon fiber laminate materials exhibit brittle (non-plastic) failure modes and typically have linear stress-strain plots until the ultimate failure (Abbott, 2019). One proven method for producing high-performance composites using synthetic fibers, such as glass or carbon fibers is Vacuum-assisted resin infusion (VARI) Technology (You et al., 2023; Xia et al., 2015). The composite manufactured by Vacuum-Assisted Resins Infusion has the highest strength and tensile modulus of the composites produced using wet hand lay-up and vacuum bagging methods (Abdurohman et al., 2018). Vacuum-assisted resin infusion can reduce internal or external good composite defects through resin impregnation (Ratwani, 2010), . The results of scanning electron microscope (SEM) imaging on the vacuum-assisted resin infusion method for producing impregnated resin composites show excellent properties at the inter-ply (interlaminar) and inter-fiber (intralaminar) interfaces. However, it is worth noting that some voids still exist in certain intralaminar locations (Bourchak et al., 2015).
Recent advancements in composite material technology have increased the use of composite materials in aircraft structures. In 2010, the Boeing 787 used more than 50% composite materials, increasing the structural mass of composite materials (Lu and Wang, 2010). One benefit of using composite materials is the reduction in weight of the aircraft structure. When compared to equivalent aluminum alloy components, it can reduce the structure's weight by more than 20% (Iryani et al., 2019; 2017; Beck et al., 2011). The advantage of the sandwich structure is its high rigidity due to its thickness and lightweight (Patekar and Kale, 2022; Zulkarnain et al., 2022; Ramnath et al, 2019). The core can be filled with low-density material such as foam, PVC, etc., and layered with the lamina arrangement (Hadi, 2020). The 19-passenger aircraft float impact study was carried out using a static simulation method. Here is a float model using aluminum material and an estimated mass of 1000 kg, significantly reducing the aircraft's payload/carrying capacity (Ardiansyah, 2019). The N219 amphibious aircraft was derived from the N219 basic aircraft (MTOW 7030 kg) by adding two floats, enabling it to land on both land and water. Despite the addition of these floats, the aircraft's performance, particularly its payload capacity, was not significantly affected. However, it is important to acknowledge that there was a weight penalty associated with this modification, which played a crucial role in determining its overall performance (Kadir et al., 2021; CASR, 2001). The existence of the Sister Keelsons on the floater generates more forces and moments in X-axis, Z-axis directions, and Y-axis rotation (Erwandi et al., 2022).
It is clear from the previous passages that composite materials for aircraft components and amphibious aircraft floaters are the subject of extensive research. However, little is known about the research into the use of composite materials as floaters for amphibious aircraft. In order to meet the design acceptance criteria, set forth by Tsai-wu criteria 1 and a minimum target weight of one floater of 400 kg, this research concentrated on structural analysis to reduce the weight of floaters N219 amphibious aircraft. As one floater currently uses aluminum and weighs 500 kg, reaching the target will increase the aircraft's economic value. With two floaters installed, the aircraft can reduce its overall weight by at least 200 kg by using composite, which means it will be able to carry more passengers, increasing its capacity to make more money. This accomplishment also marks a first for Indonesia in the development of the N219 amphibious aircraft.
The method and research phase starts with the simulation modeling of the floater structure based on the results of the surface configuration design from the aero and hydro teams (Sayuti, 2021; Fitriah, 2021). The analysis was conducted using structural analysis software and supported by material input data based on test results. Each stage is explained in detail below.
Float Structure Configuration
The surface configuration model for the floater is selected based on its intended use as a twin seaplane float. In the case of an N219 amphibious aircraft, the floater's position is depicted in Figures 1a and 1b. Each floater has a volume of 6.8 m3 or 6.8 tons, a length of 9.4 m, and a step position from the front that occupies 54% of the length of the floater (Figure 1c). With the VARI method, Sandwich Carbon Composite material was used in this floating design (Sayuti, 2021).
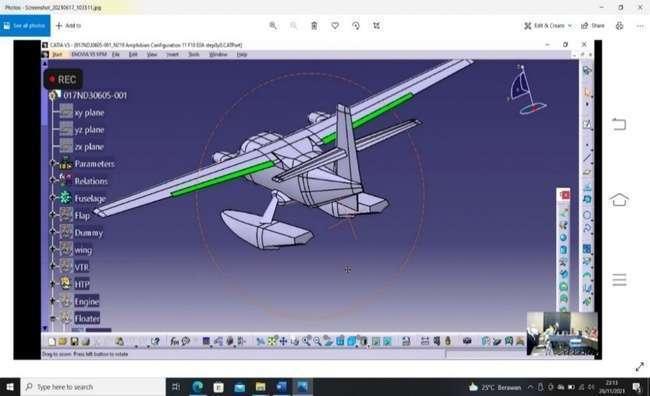
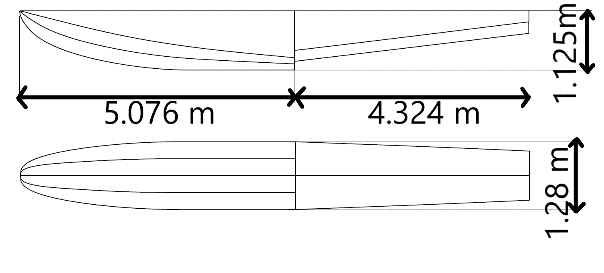
Figure 1 Illustration of floater position on N219 Amphibious aircraft (a) and Floater dimension (b).
Flowchart Model
Figure 2a shows the flowchart for the thickness iteration process of the Amphibi floater structure model. The iteration is performed as a looping process, starting at the material property step. once the simulation is completed, the failure criteria value is examined. If the value exceeds 1, the process loops back to the material property step, where the property value, comprising the number of composite plies, is adjusted. After a few plies were added, the simulation would start again. This process was repeated until the failure criteria value dropped to less than 1.
CAD Model
The isometry view of the floater model LPDP-11 is shown in Figure 2b. This floater has dimensions: length = 9.4 m, width = 1.28 m, height = 1.125 m, and volume = 6.8 m3. Most floater structures are built with a composite sandwich structure. The following Table 1 is the detail of the structure ply configuration which was used at each panel. This configuration thickness is determined systematically according to the load and allowable stress design after iteration, as mentioned in Figure 2a.
Table 1 Thickness Variation of Floater LPDP-11 structures.
Hydrostatic Pressure Distribution
Referring to National Aerospace Standard (NAS, 2015), hydrostatic pressure distribution can be obtained by using the formula below:
P=C4 K2 vso2tan 1)
The Where, P = pressure (psi), C4 = 0.078Cl (Cl=0.012), K2 = Float Station Weighing Factor, VSO = Stalling speed (45.4 knots), and ? = Dead Rise Angle.
For this model, it's been defined that the floater will carry approximately 2.33G of its MTOW, or around 8.2 tons. It is determined by referring to NAS 807 (NAS, 2015), as the lowest value of the maximum load factor that might be happened during its operational time. In order to match the load, the K2 value (Figure 3a) was adjusted so the total load from the pressure distribution would be close to the actual load but with similar pressure distribution, which is also suggested by NAS 807, (NAS, 2015). Lf is the distance from the most frontward floater to the step section (Figure 4), while LA is the distance from the step section to the most rearward floater. The data required to calculate the hydrostatic pressure is shown in Tables 2 and 3, and the yield of the pressure distribution is shown in Figure 3b.
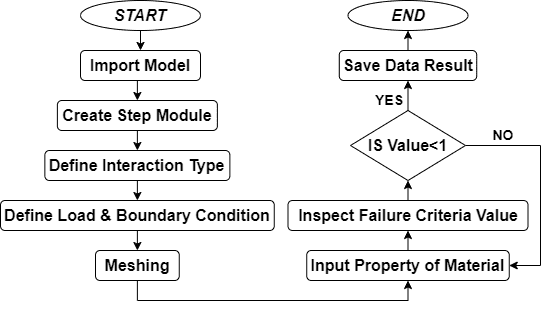
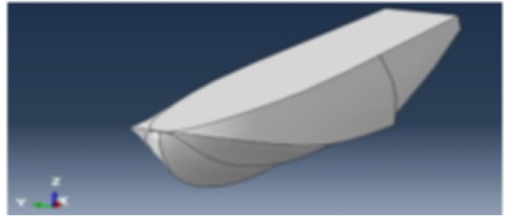
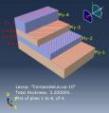
Figure 2 Floater thickness iteration flowchart (a), CAD Model floater LPDP-11 (b).
The graph which is presented is the visualization from these elaborate equations for the corresponding X range value:
from 0 ? X ? 2538 mm: y = -7.33E-06X + 0.0207
from 2538 < X ? 5076 mm: y = 2.36E-06X - 0.00383
from 5076 < X ? 9400 mm: y = -1.44E-07X + 0.0048
These equations would then be inputted as pressure distribution on FEM Software.
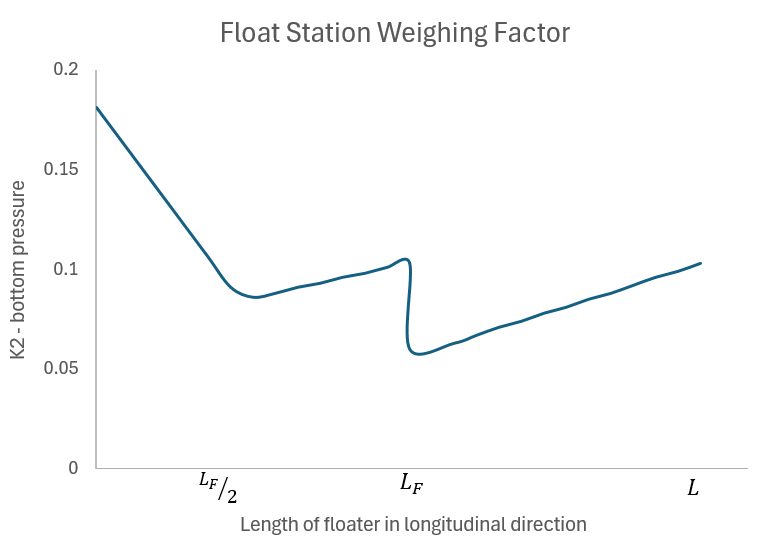
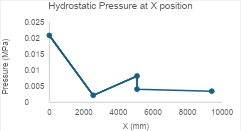
Figure 3 Float Station Weighing Factor (NAS 807) (a), Hydrostatic Pressure Distribution Through Floater Length (b).
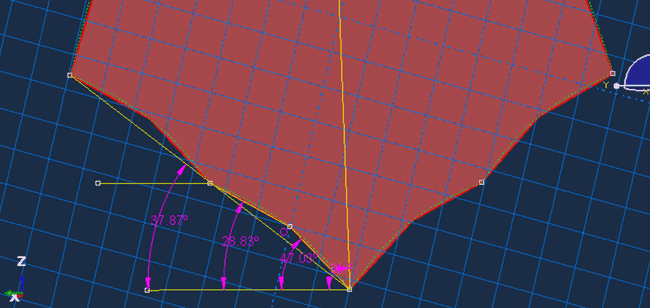
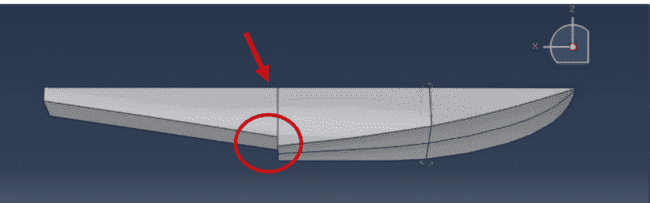
Figure 4 Deadrise angle and step section illustration. (a) Deadrise Angle, (b) Step Section.
Table 2 Constant Data for Floater's Weight Distribution
Table 3 Pressure Value at Designated Point on the Base of Floater.
Load and Boundary Condition
The boundary condition on this model was placed on the tip of the strut and spreader (see Figure 5f). Those tip from strut components was set as fixed BC ((U1=U2=U3=UR1= UR2=UR3=0), while the Boundary Condition on the spreader was set free to move on upward and downward (U1=U2=UR1=UR2=UR3=0, U3?0) with the assumption of equal hydrostatic pressure both on the left and right side of the floater.
The hydrostatic model was employed in the analysis, and the pressure was calculated before simulation to determine the loading condition. However, to observe the effects, some adjustments were made to the loading conditions during the test. The floater was subjected to various scenarios, including landing on the bow, landing on the step, unsymmetrical landing on the step, and landing on the stern under specific conditions. The pressure distribution in each condition is similar to hydrostatic, except that pressure only occurred and was applied on the corresponding part of the floater where it landed. These are the illustrations for the loading conditions depicted in Figures 5a to 5e.
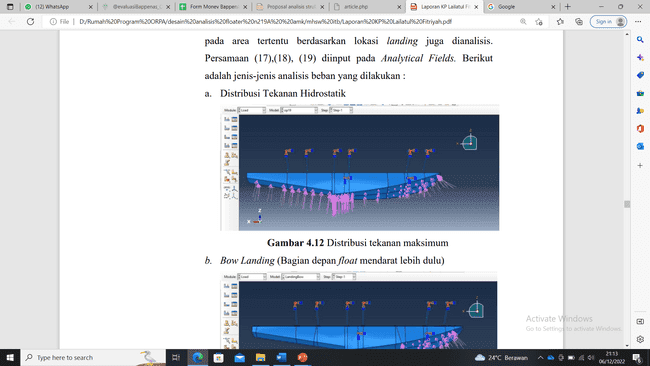
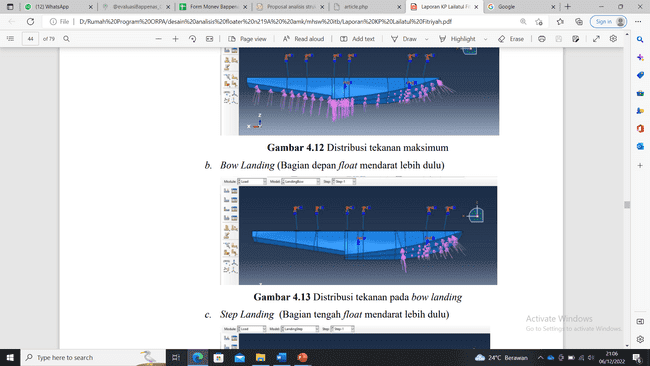
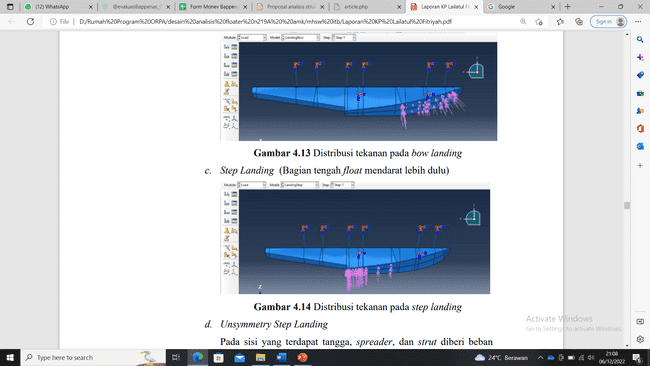
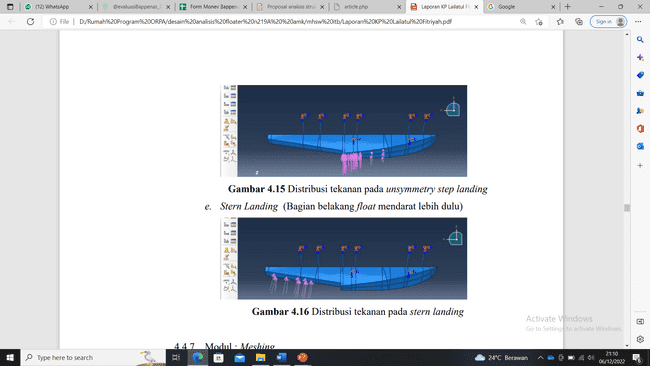
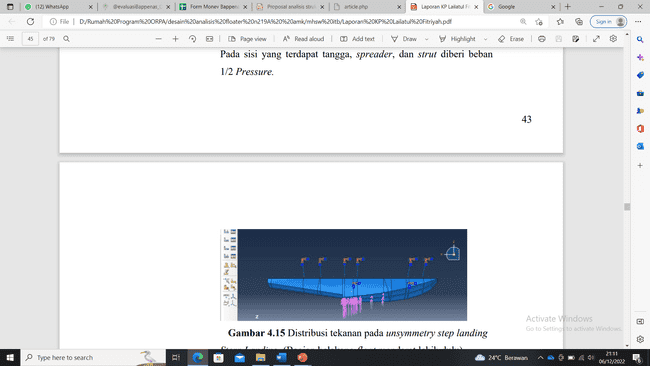
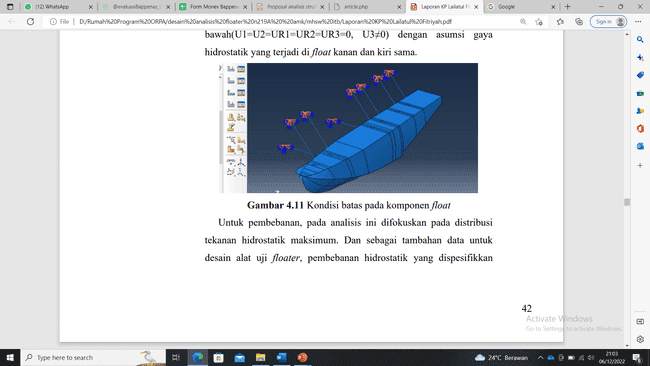
Figure 5 Loading Types and Constraint models for FEM analysis of floater LPDP-11.
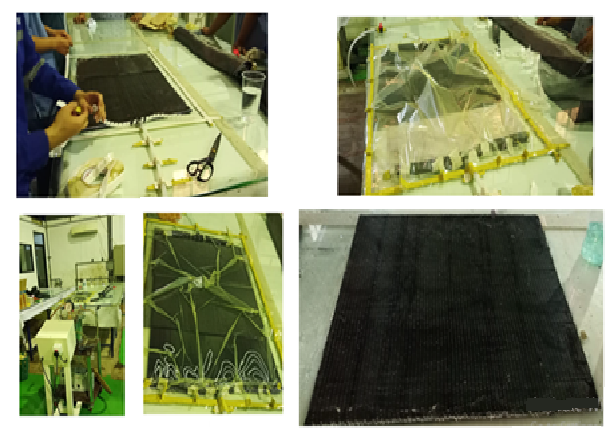
Materials
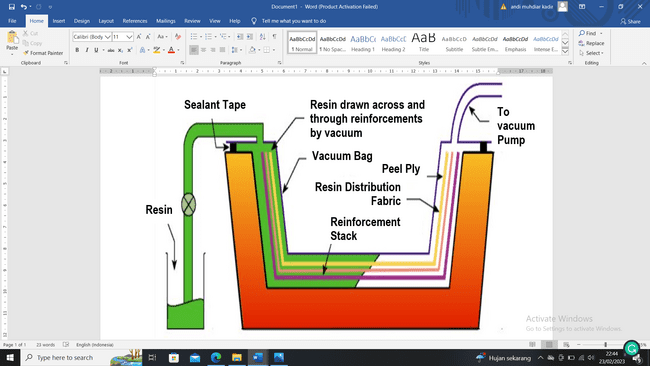
The mechanical properties of materials as data input in the Finite Element Method Analysis process are shown in Table 4. Tensile test material carbon was done to verify the tensile strength, modulus elasticity, and Poisson ratio. The method of making the test specimens used the VARI (Figure 6) to minimize the presence of voids in the composite, the VARI impregnation method in the manufacture of composites used vacuum suction to flow the resin into the fiber bundles. With a low void volume percentage, the mechanical properties of the composite were increasing. This method produces a fairly excellent and uniform quality of composite panels, so the structure's weight was expected to be lighter because there was no excess resin. This composite panel was made with a total of 6-ply layers and then cut by a water jet machine according to the direction of each remarkable test object's fibers. The number of specimens was 30 pieces. for every six pieces, tensile test specimens for composite carbon material with fiber direction (0o, 90o, 45o, -45o/+45o, 0o/90o). The test data results (tensile strength, elastic modulus, and Poisson's ratio) were used as data input for FEM (Finite Element Method) software. The composite components used in this manufacturing are Carbon Fibers Uni-Direction: ZD-BX300-1270, Carbon fiber Fabric: 220 GSM, Resin, and Hardener: AM-89267A dan AM-8927B.
Table 4 Materials for structure analysis of Floater LPDP-11
Figure 6 VARI Method (a) Sketch of VARI and (b) Manufacturing Process
Floater Structures Analysis
The visualization result of the floater model is shown in Figure 7; a summary of the result is shown in Table 5. The optimization goal is to achieve the optimal structure, which can carry the load without fail while attaining its weight as light as possible. A few load scenarios were also laid out to see their effect on structure. for this research, it can be concluded that the hydrostatic pressure yields the most critical load to structure, as seen from the failure criteria that the model sustained. from Figure 7, it can be seen that max stress occurs in the first section of the bottom skin float. It is understandable because the float station weighting factor in that position has the biggest K-factor (stress concentration factor); other than that, in that section, the bulkhead supports only skins without additional support from the frame and floor.
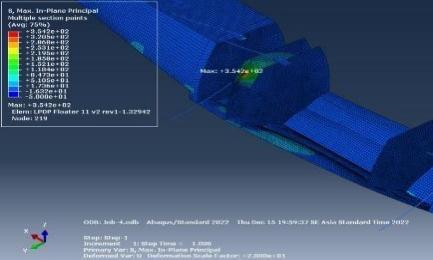
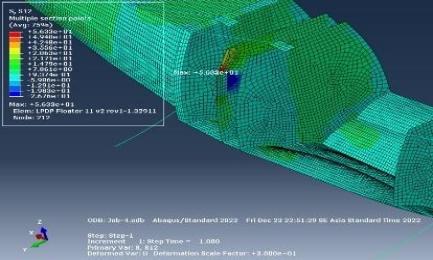
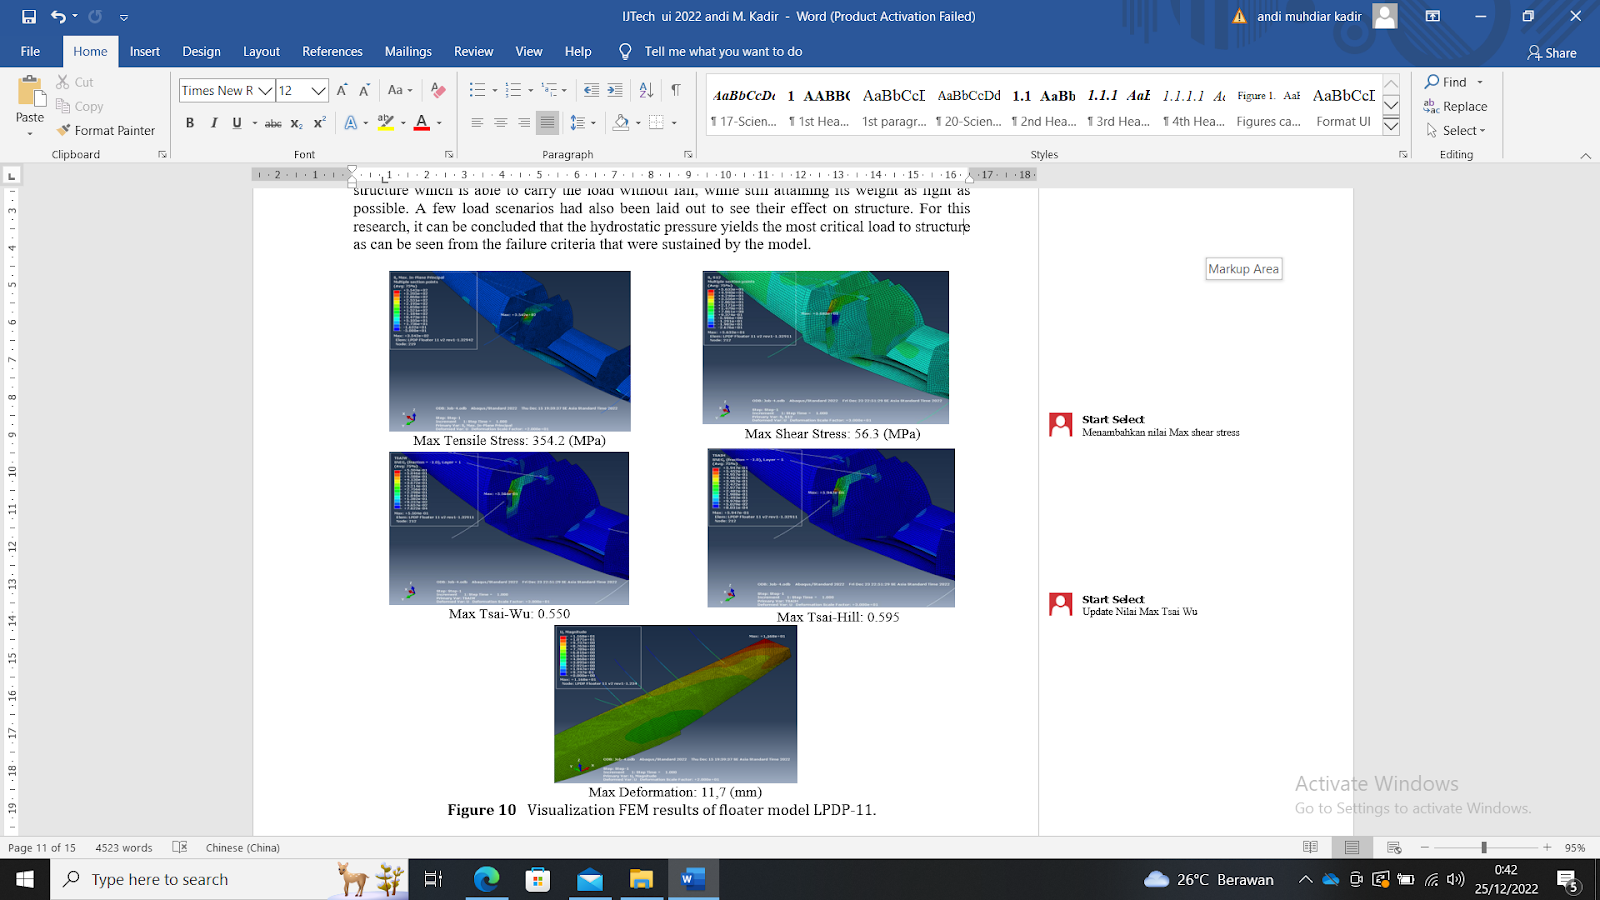
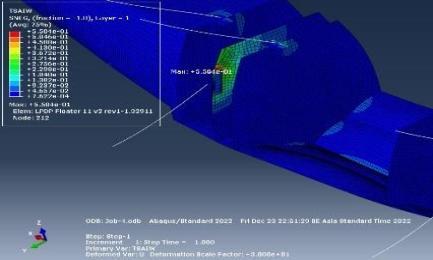
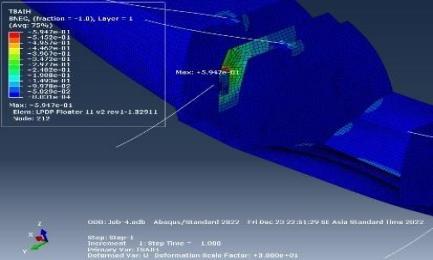
Figure 7 Visualization FEM results of floater model LPDP-11
The summary simulation results show in Table 5 with the five types of distribution pressure ultimate loading on the float with sandwich carbon composite material with 30 float thickness variation on the entire surface. The final thickness value is achieved through several iterations, during which the primary objective is to ensure that the mass of the component does not exceed the target weight of 400 kg. Note that this simulation is also conducted without considering the assembly process in actual conditions. Furthermore, the simulation also aims to help determine the critical area location. The results of this numerical analysis will include several parameters, including stress, displacement, and Tsai-Wu failure criteria. from the FEM analysis, the maximum stress that occurs is 354.2 MPa; the acceptance criterion is 0.550 for Tsai-Wu. Meanwhile, the mass of the floater structure model N219 Amphibious (LPDP-11) was obtained at 274 kg.
Table 5 Summary results of FEM structure Analysis of Floater LPDP-11.
Carbon Composite Materials Test
Tensile tests of carbon composite materials were conducted using a tensile test machine, sensors, and data acquisition equipment, as illustrated in Figure 8. Additionally, Table 6 presents a summary of the recorded data from the tensile test specimens. The average tensile strength for specimen UD (fiber orientation 0o, in-line loading) was 1014 MPa, the modulus elasticity was 108721 MPa, and the Poisson's ratio was 0.286. In the meantime, the average tensile strength for Fabric specimens (fiber orientation 0o/90o, load in-line to 0o) was 574 MPa, the modulus elasticity was 45462 MPa, and the Poisson's ratio was 0.042.
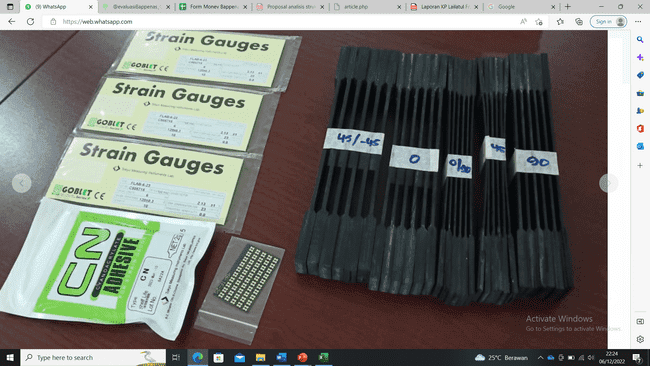
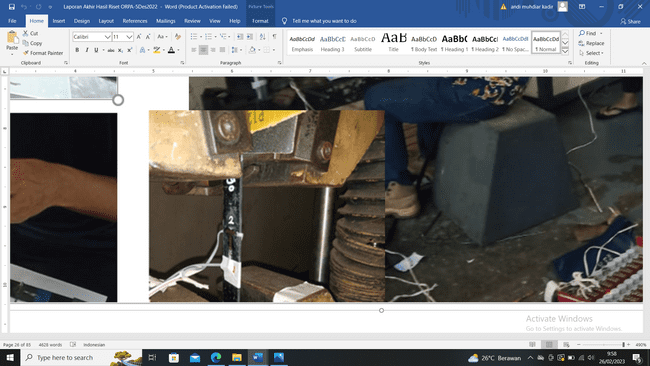
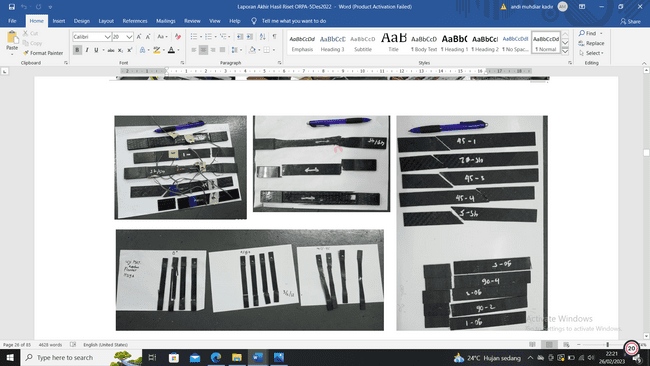
Figure 8 Tensile test material carbon composite produced by the VARI method.
(a) Specimens before the test, (b) Tensile test machine, (c) Specimens after the test.
The test results are presented as a graph that depicts the relationship between the testing machine's force and strain as measured by a data logger in Figure 9.
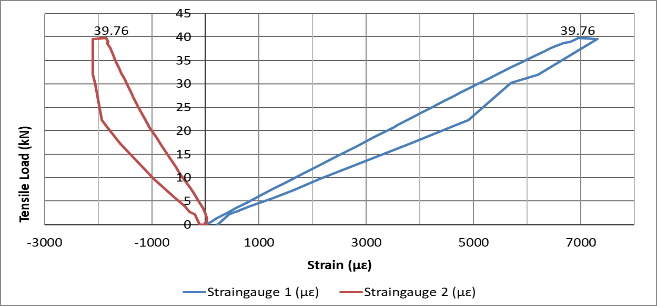
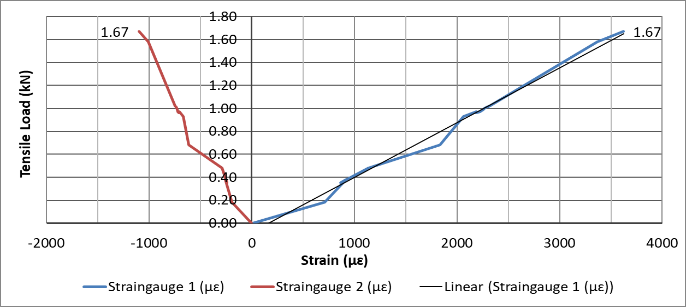
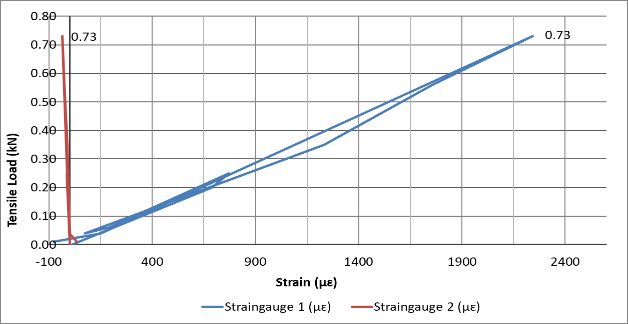
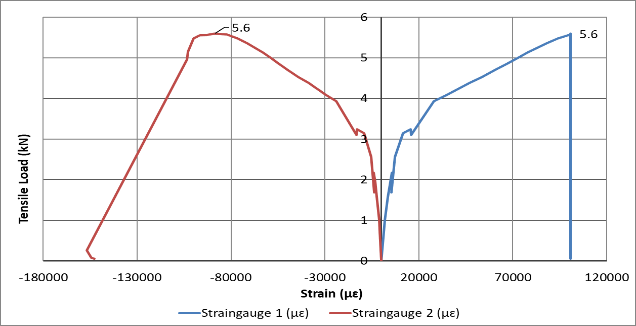
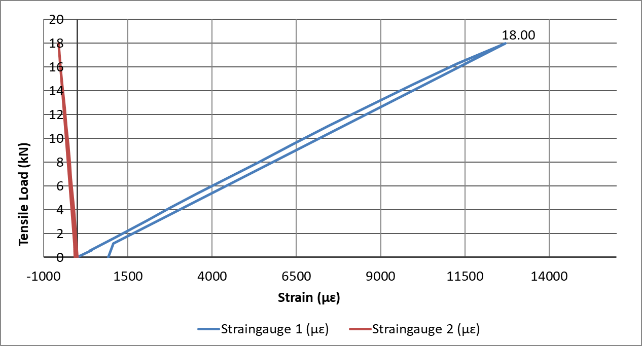
Figure 9 Graphic of force vs. strain. Specimen fiber orientation: a)UD-0o, b)UD-45o, c)UD-90o , d)Fabric- ±45o, and e) Fabric-0o/90o.
Table 6 Summary of Test carbon composite Materials (VARI method)
Floater Structure Verification
The 19-passenger aircraft float impact study was carried out in previous research by (Ardiansyah, 2019) using a static simulation method where float modeling uses aluminum material and an estimated mass of 1000 kg. In this research, the structural analysis of the floater LPDP-11 Floater with FEM results shows that the maximum stress that occurs is 354.2 MPa with a Tsai-Wu and Tsai-Hill criterion value of 0.5504 and 0.5947 respectively, where the value is limited to less than 1. The results show that working stress is still safe. The tensile test results for carbon composite materials show that the average maximum tensile strength of UD carbon composite materials (0o/fiber direction) is 1014 MPa, while the average maximum tensile strength of Fabric type carbon composite materials (0o/90o fiber direction) is 574 MPa. This value is still safe against the maximum tensile stress in the FEM simulation, which is 354.2 MPa. Based on the results of the FEM simulation, it has been determined that the total weight of the one-piece Floater N219 Amphibious LPDP-11 model is 274 kg, which is lower than the value reported by (Kadir, 2022; Kadir and Setyawan, 2021). This indicates that both strength and weight meet the planned criteria, so the results of this research have the potential to be implemented.
The model structure was analyzed to reduce the weight of floater N219A LPDP-11 by applying the optimal design dan used the composite sandwich materials. Data tensile test specimens with five fiber orientations from carbon composite material produced by Vacuum-Assisted Resin Infusion (VARI) were tested and used as data input in structure analysis to predict the strength and weight. The results showed that the maximum stress was 354.2 MPa < 1014 MPa (UD-carbon fiber composite material test result). Meanwhile, the Tsai-wu criteria were 0.5504, and the Tsai-Hill criteria were 0.5947, where it's <1, and the mass of the floater found was 274 kg, where it was <400 kg. It could be seen that the floater structure design using carbon composite materials had good results, so it could be considered for implementation. The research in this paper is still limited to the analysis of float structures with FEM supported by data on the results of laminated composite carbon material tests and has the potential for improvement in future research by testing composites with a structure already in the form of a sandwich where the laminated composite is the same used in this research to validate the analysis, and its structure is more closely to FEM analysis. In the future, it is envisioned that a full-scale test will be performed to ensure the verification is as close to the actual condition as possible.
The authors would like to thank the Research Center for Aeronautics Technology (Pusat Riset Teknologi Penerbangan), Research Organization for Aeronautics and Space (Organisasi Riset Penerbangan dan Antariksa) - ORPA, BRIN for providing grants in 2022 and all the team research.
Author Contributions
The authors made substantial contributions in conceptualizing and designing the study. The authors claim full responsibility for the analysis, interpretation, and discussion of the findings. Additionally, all authors reviewed and provided their approval for the final version of the manuscript.
Conflict of Interest
The authors declare that there are no conflicts of interest.
Aroonsaengmanee, C., Watjatrakul, B. and Nontakaew, U., 2020, July. Conceptual design and Optimization of 2-seater Seaplanes. In IOP Conference Series: Materials Science and Engineering (Vol. 886, No. 1, p. 012009). IOP Publishing.
Abbott, R 2019, ‘Analysis and design of composite and metallic flight vehicle structures’, 3rd edn, Abbott Aerospace SEZC Ltd.: Collingwood, ON, Canada
Abdurohman, K, Satrio, T, Muzayadah, NL & Teten 2018, ‘A comparison process between hand lay-up, vacuum infusion and vacuum bagging method toward e-glass EW 185/lycal composites’, Journal of Physics Conference Series, vol. 1130, article, 012018, doi :10.1088/1742-6596/1130/1/012018
Alabsi, SS, Khir, MHM, Dennis, JO, Ba Hashwan, SS & Algamili, AS 2023, ‘Optoelectronic characterization and properties of single-walled carbon nanotubes in a liquid dispersion form’, International Journal of Technology, vol. 14, no. 1, pp. 65-77, https://doi.org/10.14716/ijtech.v14i1.5124
Aliffrananda, MHN, Sulisetyono, A, Hermawan, YA, Zubaydi, A 2022, ‘Numerical analysis of floatplane porpoising instability in calm water during takeoff’, International Journal of Technology, vol. 13, no. 1, pp. 190-201, https://doi.org/10.14716/ijtech.v13i1.4903
Ardiansyah, R & Adhitya, M 2019, ‘Simulation of float of 19 passenger aircraft during landing on water surface’, In: IOP Conference Series: Materials Science and Engineering, vol. 694, no. 1, article 12005, doi:10.1088/1757-899X/694/1/012005
Beck, AJ, Hodzic, A, Soutis, C, Wilson, CW 2011, ‘Influence of implementation of composite materials in civil aircraft industry on reduction of environmental pollution and greenhouse effect’, In: IOP Conference Series: Materials Science and Engineering, vol. 26, article 012015, doi:10.1088/1757-899X/26/1/012015
Bendarkar, M.V., Pant, R.S. and Eberhardt, S., 2013. Conceptual Design and Sizing of an Amphibian Transport Aircraft. In 2013 Aviation Technology, Integration, and Operations Conference (p. 4303).
Bourchak, M & Harasani, W 2015, ‘Assessment of liquid resin infusion impregnation quality using scanning electron microscopy’, Advanced Composites Letters, vol. 24, pp. 6-11, https://doi.org/10.1177/096369351502400102
Canamar Leyva, A.L., 2012. Seaplane conceptual design and sizing (Doctoral dissertation, University of Glasgow).
Canamar, A.L. and Smrcek, L., 2011. Seaplane Conceptual Design (No. 2011-01-2696). SAE Technical Paper.
Civil Aviation Safety Regulation (CASR) 2001, CASR Part 23, Civil Aviation Safety Regulation
Erwandi, Aribowo, A, Kartika, BSD, Rahuna, D, Nurhadi, Ali, B, Nasir, M 2022, ‘The influence of sister keelsons on the hydrodynamic loads of N219A float models’, In: 9th International Seminar on Aerospace Science and Technology – ISAST 2022, article 020016, https://doi.org/10.1063/5.0181472
Fitriah, L 2021, ‘Optimization of the composite sandwich structure on the float of the amphibious N-219 aircraft using the finite element method’. Bandung
Gudmundsson, S 2013, General aviation aircraft design: applied method and procedures. Elsevier, Inc.
Hadi, BK 2020, Mekanika struktur komposit. ITB, Bandung.
Hamza, S, Heidari, M, Ahmadizadeh, M, Dashtizadeh, M, Chitt, M 2023, ‘Modification of horizontal wind turbine blade: a finite element analysis’, International Journal of Technology, vol. 14, no. 1, pp. 5-14, https://doi.org/10.14716/ijtech.v14i1.5255
Harahap, M, Daulay, N, Zebua, D, Gea, S 2023, ‘Nanofiber cellulose/lignin from oil palm empty fruit bunches and the potential for carbon fiber precursor prepared by wet-spinning’, International Journal of Technology, vol. 14, no. 1, pp. 152-161, https://doi.org/10.14716/ijtech.v14i1.5082
Iryani, L, Kadir, AM & Irawan, B 2017, ‘Design and analysis of spar I beam profile using composite material in UAV structure’, In: Proceedings of the Sixth Annual South Asian International Seminar (ASAIS). Jakarta, vol. 2017, pp. 45-50
Iryani, L Kadir, AMM, Irawadi, Y & Triwinanto, P 2019, ‘Manufacturing spar I Beam profile of UAV wing structure made of composite material’, Journal of Advanced Research in Dynamical and Control Systems, vol. 11, pp. 556-562
Kadir, AM 2022, ‘Design and structural analysis of n219 floater using composite materials’. Serpong.
Kadir, AM, Setyawan, A 2021, ‘N219A Floater Structure Analysis’. Serpong.
Lu, B. and Wang, N., 2010. The Boeing 787 dreamliner designing an aircraft for the future. Journal of Young Investigators, 4026, p.34.
Lv, J, Grenestedt, JL 2015, ‘Analytical Study of the Responses of Bottom Panels to Slamming Loads’, Ocean Engineering, vol. 94, pp. 116-125, https://doi.org/10.1016/j.oceaneng.2014.11.009
National Aerospace Standard (NAS) 2015, NAS 807 Revision 1, Specification – Twin Seaplane Floats.
Ngo, T-D 2020, ‘Introduction to Composite Materials’, In: Composite and Nanocomposite Materials. IntechOpen.
Patekar, V & Kale, K, 2022 ‘State of the art review on mechanical properties of sandwich composite structures’, Polymer Composites, vol. 43, no. 9, pp.5820-5830, https://doi.org/10.1002/pc.26989
Piovesan, G., 2017, ‘Seaplane water landing loads. Impact simulation’, POLITesi - Archivio digitale delle tesi di laurea e di dottorato
Ramnath, BV, Alagarraja, K & Elanchezhian, C, 2019, ‘Review on sandwich composite and their applications’, Materials Today: Proceedings, vol. 16, pp.859-864, https://doi.org/10.1016/j.matpr.2019.05.169
Ratwani, M.M., 2010. ‘Composite materials and sandwich structures–A primer’ Rto-En-Avt, 156, pp.1-16
Sayuti, S 2021, ‘Development of floater design for the flightworthiness test of the n219 amphibious aircraft’. Jakarta.
von Karman, T 1929, ‘The impact on seaplane floats during landing’, NACA-TN-321
Xia, C, Shi, SQ, Cai, L 2015, 'Vacuum-assisted resin infusion (VARI) and hot pressing for CaCO3 nanoparticle treated kenaf fiber reinforced composites', Composites Part B: Engineering, vol. 78, pp. 138-143, https://doi.org/10.1016/j.compositesb.2015.03.039
Yanuar, Gunawan, Utomo, ASA, Luthfi, MN, Baezal, MAB, Majid, FR.S & Chairunisa, Z, 2020, ‘Numerical and experimental analysis of total hull resistance on floating catamaran pontoon for N219 seaplanes based on biomimetics design with clearance configuration’, International Journal of Technology, vol. 11, no. 7, pp. 1397-1405, https://doi.org/10.14716/ijtech.v11i7.4503
You, G, Gao, X, Chen, J, Zhao, K 2023, 'Experimental and Numerical Simulation of Resin Flowing in VARI Process', Fibers and Polymers, https://doi.org/10.1007/s12221-023-00261-1
Zulkarnain, M., Tofrowaih, K.A. and Ariyanti, S., 2022. Effect of Natural Fibers Reinforcement of Honeycomb Sandwich Using Numerical Analysis. International Journal of Technology, 13(4), https://doi.org/10.14716/ijtech.v13i4.5098