A Technique to Predict Bankruptcy Using Ultimate Ownership Network as Key Indicators
Corresponding email: heru@cs.ui.ac.id
Published at : 31 Jan 2025
Volume : IJtech
Vol 16, No 1 (2025)
DOI : https://doi.org/10.14716/ijtech.v16i1.7516
Rahayu, DS, Husodo, ZA, Pidanic, J, Li, X & Suhartanto, H 2025, 'A technique to predict bankruptcy using ultimate ownership network as key indicators', International Journal of Technology, vol. 16, no. 1, pp. 275-288
| Dyah Sulistyowati Rahayu | Faculty of Computer Science, Universitas Indonesia, Depok, 16424, Indonesia |
| Zaäfri Ananto Husodo | Faculty of Economic and Business, Universitas Indonesia, Depok, 16424, Indonesia |
| Jan Pidanic | Faculty of Electrical Engineering and Informatics, University of Pardubice, Pardubice, 53210, Republic of Czech |
| Xue Li | School of Electrical Engineering and Computer Science, The University of Queensland, QLD 4072, Australia |
| Heru Suhartanto | Faculty of Computer Science, Universitas Indonesia, Depok, 16424, Indonesia |

Predicting bankruptcy is crucial to avert company failures, which could lead to a systemic collapse of the economy. This study examines the network of executives, directors, and shareholders to identify conglomerates, which are often characterized by a lack of explicit connections between these individuals or institutions. Understanding these networks is crucial for mitigating the risk of bankruptcy and its potential systemic effects. We proposed a technique that uses non-financial factors that could serve as predictors of bankruptcy, as well as the link among the ultimate owners. A regression analysis is employed to evaluate the network’s effect on bankruptcy prediction. The findings indicate a significant impact of the directors’ degree of centrality and the direct bankruptcy rate of director and executive networks on the likelihood of bankruptcy. Additionally, the predictions for one and two years ahead are significantly influenced by the strength or weighted degree of centrality and betweenness centrality of directors. Notably, the influence of executive and shareholder indirect bankruptcy rates becomes increasingly prominent in predicting distress. These results offer a novel perspective on incorporating network variables into bankruptcy prediction models, with an accuracy of 86% using random forest and XGBoost models. The findings indicate that bankruptcy prediction techniques can employ network variables, as alternative data to financial indicators.
Bankruptcy; Machine learning; Network; Prediction; Ultimate ownership
The topic of bankruptcy prediction research is compelling due to its potential broader implications on general economic and social conditions. The factors causing bankruptcy continue to be explored, especially with the presence of certain crisis conditions that come suddenly, such as a pandemic (Shkarupeta et al., 2024). Numerous bankruptcy prediction research has employed diverse methodologies, including economic models (Kang et al., 2022) and machine learning (Shetty et al., 2022; Ben Jabeur, 2017). Research also integrates economic models with machine learning, shown by the Z-Score model in conjunction with Multilayer Perceptron - Artificial Neural Network (MLP-ANN) models (Wu et al., 2022) and Black-Scholes-Merton computed via neural networks (Charalambous et al., 2023).
The majority utilizes financial variables, financial ratios, and market data (Papík and Papíková, 2023). Recently, some studies have attempted to predict bankruptcy using non-financial variables to expand beyond the limited scope of financial metrics. Ownership structure and concentration, board size and composition, as well as the size and existence of the audit committee, are among these factors (Ragab and Saleh, 2022). Variables such as the controlling shareholder’s equity pledge (Wang et al., 2022), the percentage of major shareholders and executives and the proportion of independent directors (Nie et al., 2023), the textual value of annual reports (Chen et al., 2023), and the tardiness in submitting annual reports (Kanapickien? et al., 2023) serve as non-financial predictors of bankruptcy.
The broader implications of bankruptcy prediction relate to systemic risk, which is defined as the collapse of a system resulting from the contagion of bankruptcy from one member to the entire system (Wihlborg, 2018). Systemic risk research primarily focuses on banking institutions due to their custodianship of substantial public funds and their crucial role in the economic stability and turnover of the financial system (Köster and Pelster, 2018). Kamei et al. (2017) propose an alternative viewpoint, emphasizing that the bankruptcy of a member closely interconnected with others needs to be taken into consideration when measuring systemic risk. The interconnectedness within the industrial sector can serve as an indicator of systemic risk too (Cheng et al., 2017).
Several previous studies have discussed financial networks and their intricate financial aspects. Assessing each of these variables for subsequent study purposes is notably challenging despite the topic's inherent interest. Some are interested in digging deeper into the connectedness that can be formed by any variable, for example, the network of US industries, which is formed from the daily volatility of the 10 most significant sector industry portfolios (Anghel and Caraiani, 2024). Research has successfully shown that the influence of the energy sector on investor sentiment volatility is quite strong.
The ultimate ownership theory encompasses various parameters that define the ownership structure of corporations (Vivandari and Fitriany, 2019). According to principal-agent theory, different ultimate decision-makers in entrepreneurial enterprises influence financial and market performance (Yin et al., 2017). Moreover, the nature of ultimate ownership influences firms' environmental responsibility (Dong et al., 2022) and public banking industry performances (Ulyah et al., 2024), especially for state-owned enterprises (SOEs). The influence of ultimate ownership extends to financial aspects such as stock market liquidity (Abbassi et al., 2021), bank competition(Azar et al., 2022), and bankruptcy (Nie et al., 2023; Ragab and Saleh, 2022; Wang et al., 2022; Li et al., 2021). Additionally, the consolidation of ownership of the voting class during bankruptcy can affect the speed of restructuring, the likelihood of liquidation, and overall recovery rates (Ivashina et al., 2016). This finding indicates that ownership changes during financial distress can significantly impact the outcome of the bankruptcy process.
The ultimate owner can be a conglomerate that puts family or relatives as executives or commissioners and directors (Attig et al., 2020). A conglomerate is defined as a large company made up of several different independent businesses, can be single or multi-sector, and owns and controls other companies. Conglomerates have proven to have an impact on their media ownership (Neff and Benson, 2021). We recognize a lack in the exploration of how the ultimate ownership networks influence bankruptcy and systemic risk. We aim to investigate the significance of the networks of executives, directors, and shareholders in predicting distress.
This work makes several novel contributions. To the best of our knowledge, we present the first analysis of this type of network as a bankruptcy predictor. Other research solely utilizes the aggregate percentage of shares; however, we employ each entity as a node within our network (Ahmad, 2019). Zhao et al. (2024) use quite complete company relational information but only assess the company-director-company relation, while in this study we use three types of networks, i.e., directors, executives, and shareholders (Zhao et al., 2024). This perspective allows us to differentiate the importance of each entity in relation to financial distress.
The network of systemic risk often revolves around capital flow, including debtors and creditors. However, many of the relevant variables are not publicly available. The accessible data for our proposed predictor, sourced from annual reports or company websites, constituted the second key contribution of our work. Finally, we provide a different perspective on utilizing non-financial variables as predictors of a firm’s financial distress. We also demonstrate the accuracy across several machine learning models to ensure that the variables can serve as reliable predictors.
This article is organized as follows: In Section 2, we review bankruptcy and the company’s network. We also discuss the theory of the ultimate ownership of public firms. In this section, we present our data, how to build the network, and extract its variables. In Section 3, we provide our empirical results and a discussion. Finally, in Section 4, we conclude and provide recommendations for future studies.
This chapter comprises a discussion on bankruptcy, the networks formed by certain interconnected variables, machine learning, and feature selection methods, and the data utilized in this research.
2.1. Bankruptcy and the network of companies
This study employs a financial distress term to identify the unhealthiness of a firm. It is characterized by negative profits over two consecutive years, as in Li and Sun (2011). Distress and bankruptcy are often used interchangeably, as distress typically precedes bankruptcy.
The term “connectedness” refers to the network that has been built in finance problems (Diebold and Y?lmaz, 2023). Their recent publication asserts that international trade, the import-export network, and systemic financial risk, specifically the marginal expected shortfall or CoVaR of all the members of the economic system, can be visualized in a network.
The five types of ultimate owners identified include individuals or families, the state, financial institutions, publicly held corporations, and miscellaneous entities (Vivandari and Fitriany, 2019). Ownership can be categorized as common ownership or cross-ownership (Azar et al., 2022). Common ownership refers to the number of firms commonly owned by the same investor, whereas cross-ownership pertains to the mutual ownership of shares among firms. Ownership structure can measure corporate governance, such as by the state ownership, proportion of shares held by the board or supervisor, or institutional shareholder (Wang et al. 2018; Li et al., 2014).
With respect to the ultimate ownership concept, one study reported that shareholders are not exclusively legitimate owners (Attig et al., 2020). Families or large corporations controlled by individuals may not list their own name as shareholders; instead, they choose a representative such as a director, executive, or commissioner. Directors are responsible for the day-to-day activities of a company, while executives oversee the work of all directors. The separation between directors and executives typically occurs in countries that adopt a two-tier board system. The network connected by them might symbolize a complex structure of ultimate ownership.
Researchers have sought to identify the influential nodes inside complicated networks. Several utilize degree centrality, eigenvector centrality, closeness centrality(Zhong et al., 2018), and betweenness centrality (Firdausiah Mansur et al., 2017). Alternative methods such as RankCLus or NetCLus have been employed to evaluate the network structured by its eigenvector centrality (Sun, et al., 2009a; 2009b). Recognizing the influential nodes allows for the determination of the ultimate owner in the firm network.
2.2. Machine learning and feature selection in bankruptcy prediction
Numerous machine learning techniques are employed in bankruptcy prediction research, ranging from basic methods such as k-nearest neighbor (KNN) to advanced deep learning approaches. They achieve a satisfactory outcome by employing numerous predictors, both financial and non-financial. Financial variables encompass balance sheets, financial ratios, market data, and macroeconomic indicators. Non-financial variables are constituted by company governance, corporate structure, textual elements, or interconnectivity. The methods that surpassed others are extreme gradient boosting (XGBoost) (Carmona et al., 2018) and Random Forest (Rahayu and Suhartanto, 2020). XGBoost functions by iteratively constructing decision trees, calculating the residuals, and refining the forecasts. Random forest is frequently employed and exhibits great accuracy as it constructs several decision trees by random feature partitioning and selects the final model by averaging all the generated trees (Ma’ruf et al., 2024). This study also uses logistic regression to show the simple method and high explainability of what variables are included.
Researchers employ feature selection methods to identify the appropriate variables from many possibilities (Romahadi et al, 2024). Depending on the method employed, they may apply feature importance or regression analysis. This study employs Recursive Feature Elimination (RFE) and the Elastic Net technique for feature selection in regression analysis. RFE removes features that contain biased information to achieve optimal accuracy and variable selection (Bahl et al., 2019). While the elastic-net regression works by shrinking the coefficients of irrelevant variables to zero, thereby improving model performance.
2.3. Data and network description
The data employed are derived from the Indonesian Capital Market, specifically from the annual reports of each organization from 2010-2021. An average year, the market hosts between 400 and 700 publicly traded companies. We compiled the executives (commissioners in certain firms), directors, shareholders, and auditors for this study. The identical year of the same individual or organization of two firms contributes a value of 1 to the association and the network’s edge. Whether raw or compiled, data will be available to authors upon request. We subsequently excluded auditors due to a lack of significant inter-firm relationships. The dependent variable is financial distress status. Our class exhibits an imbalance, with a ratio of approximately 20:80.
Three networks, constructed from data covering 2010-2019, serve as the independent variables: director, executive, and shareholder. The data for 2020 and 2021 are used as the target variables for predicting one year (Y+1) and two years (Y+2) ahead, which is the status of bankruptcy. The nodes represent enterprises interconnected by edges, with the edge denoting an executive (C), director (D), or shareholder (S) occupying the position in the same year as the annual report. We utilize the network library to obtain the values of independent variables except direct and indirect bankruptcy rate, specifically degree centrality, eigenvector centrality, betweenness centrality, strength or weighted degree centrality, and clustering coefficient (Hagberg et al., 2008).
The following network variables are described:
Degree Centrality: The number of direct connections between two companies (Hansen et al., 2011). deg?(a) measures all firms that are connected to a in the matrix or network N. The variables are designated degC, degD, and degS, representing executive, director, and shareholder networks, respectively. See Equation 1.

Strength or weighted degree centrality: The number of direct connections (edges) a firm possesses within a network (Hansen et al., 2011). The greater the strength is, the more significant the entity. The metrics are identical with degree centrality, but it incorporate weight from all connections. The variables are wdegC, wdegD, and wdegS. See Equation 2.

Eigenvector centrality: This quantifies a firm’s significance based on its eigenvalue (Hansen et al., 2011). A is the adjacency matrix graph, c is the non-zero vector, and is a scalar. The variables are named eigC, eigD, and eigS. See Equation 3.

Weighted betweenness centrality: the frequency with which a firm serves as an intermediary in connecting two other firms (Hansen et al., 2011). It measures the importance of a node as the shortest path between two companies, where n
 is the total number of paths between i and j, and ai,jn is the number of paths between the pair that pass through node n (Al-Ward et al., 2022). This variable employs inverted weights derived from the inverse of the number of executives, directors, or shareholders as determined by the estimated network. The variables are betC, betD, and betS. See Equation 4.

Weighted clustering coefficient: Assess the extent to which nodes in a network have a tendency to cluster collectively. It can be measured by dividing twice the number of edges for node i with the sum of its neighboring nodes(Kong et al., 2019). The edge Ei use the inverted weight from the number of executives, directors, or shareholders according to the network calculated. There are clusC, clusD, and clusS. See Equation 5.

Direct bankruptcy rate: Quantifies the aggregate bankruptcy rate of the edges that are directly connected to a firm. This metric is inspired by Tobback et al. (2017). The bankruptcy rate of individual executives and directors and individual or organizational shareholders B-ratei is determined by the historical probability of the bankruptcy proceedings in which they join. The variables are dirBC, dirBD, and dirBS. See Equation 6 for the bankruptcy rate, and Equation 7 for the direct bankruptcy rate.

Undirect bankruptcy rate: Assesses the aggregate bankruptcy rates of edges that are indirectly associated with a firm. The bankruptcy rate of all weights is a summary of all the subgraphs. The main difference between the direct and indirect bankruptcy rates is we only sum the edge’s weight directly connected to node i in the direct bankruptcy rate, while we sum the edge’ weight of all the subgraphs of node i in the indirect bankruptcy rate. The variables are named indBC, indBD, and indBS. See Equation 8.

2.4. Proposed Experiment Approach
The experiment approach was proposed and conducted sequentially, as illustrated in Figure 1. Collecting and extracting data from company annual reports and the Indonesia Capital Market Directory due to the absence of a public dataset for board members and shareholders. Subsequently, we clean data by correcting typographical errors and inconsistencies in name formatting. We also address duplicate and missing values. Upon data preparation, we transform it into ten annual relation matrices. We must ascertain the annual growth of the network by building it each year as economic data evolves throughout time series and incorporate seasonal information, as noted in Eremina and Rodionov (2023).

Figure 1 Proposed Experiment Approach
The chosen variable is based on the ultimate ownership theory. It differs from Corporate Governance Variables (CGI) as outlined by Zhao et al. (2024) and Li et al. (2021). The CGI use a percentage of ownership of both director and shareholder, while in this study, we use relational entities. Zhao’s complex network analysis approach to company relational information likewise diverges from ours. It examined solely the director-firm-director network, whereas we have three networks: director, executives, and shareholder, as indicated by the idea of ultimate ownership. Although centrality has been utilized in the past, it has never been applied to this type of network for bankruptcy prediction. We additionally propose two new variables: direct bankruptcy rate and indirect bankruptcy rate.
Due to the presence of 21 variables, we utilized two distinct feature selection methods. The RFE and Elastic-Net may yield different sets of variables for use in predictive modelling. Then, the evaluation metrics are executed in the final process with accuracy.
The experiment primarily took place on an Apple M1 CPU with 8GB of memory utilizing Jupyter Python in a local environment. We utilize the Python standard library and NetworkX to calculate five of seven network variables and to visualize the network. The algorithm's average operating time was approximately 40 seconds, beginning with constructing the matrix relational using raw data that includes the names of entities and the years they controlled the firms. The majority of the algorithm's runtime, from data processing to final output, was attributed to the transformation of raw data into a matrix of weighted relational firms, which took nearly 30 seconds. The remainder of that is a relatively simple procedure. Three raw data files in Excel, comprising directors, executives, and shareholders, each under 1 megabyte, were imported and processed in 0.1 seconds. Each processing time for computing the variable is under 1 second, except for betweenness which requires 1.2 seconds.
We employ logistic regression to examine the statistical significance of efficiency metrics in elucidating the probability of default. We also intend to demonstrate that the network variable influences bankruptcy prediction, hence impacting systemic risk. In the preprocess of machine learning, to select the set of informative features, we employ recursive feature elimination (RFE) and elastic network regression.
Three networks are present: the executive or commissioner network in Figure 2, the director network in Figure 3, and the shareholder network as seen in Figure 4. These figures represent the final conditions of the networks, reflecting data from the year 2019. How to build the network already delivered in Chapter II Section C, that vertices represent firms and edges represent the person or institution of executives, directors, or shareholders. Each network comprises seven variables, yielding a total of 21 independent variables for analysis.
The network of executives exhibits a densely connected core, and several smaller clusters or isolated nodes around it. The central core is typically connected by a prominent individual or businessperson who supervises the directors' activities. This role may be occupied by a politician, specifically tailored for a government-owned enterprise. Some cluster network denotes conglomerates or groups ultimately owned by a family or a person, exemplified by insets A and B in Figure 2.
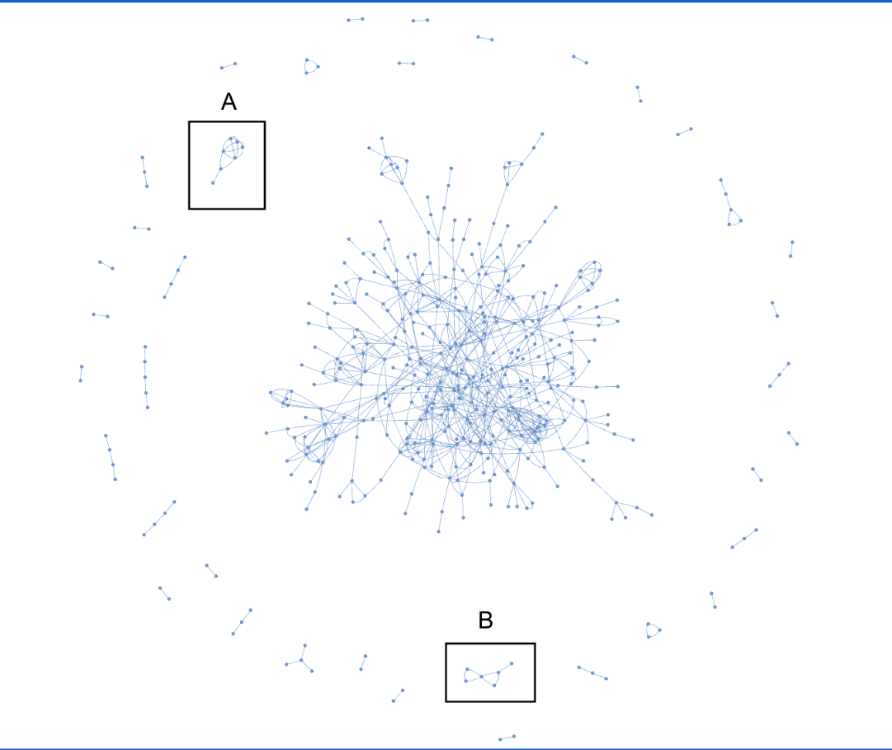
Figure 2 Network of executives. Inset A and B are examples of conglomerate or group
The network of directors has many isolated pairs and tiny clusters of nodes. The overall network seems to be a sparse and loosely connected graph. This may be attributed to the responsibilities of directors overseeing the daily operations and policies of the firm. Fewer directors occupy multiple firms concurrently. The strongest connections are formed across different years. Each director maintains tenure at the same company for an average of 4 years, with a minimum of 1 year and a maximum of 10 years, based on data spanning from 2010 to 2019. In Figure 3, Inset A illustrates a conglomeration across various sectors, while Inset B depicts enterprises that are interconnected within a single sector. As previously discussed, the directors must possess knowledge and a strong track record, so, the connections are limited, yet they last over extended periods.
The core of the shareholder graph is significantly linked to a huge investment institution. However, some of the connections are identified by the name of the individual from a specific family. Distinct first names associated with the same family name are classified as a group. While the sparse graph is connected by an individual who owned the majority of shares. Some of them are individual investors or various holding institutions.
There are 21 variables of network; degC, degD, and degS are the degree centrality of executives (C), directors (D), and shareholders (S); wdegC, wdegD, wdegS are the weighted degree centrality or strength of executives (C), directors (D), and shareholders (S); eigC, eigD, amd eigS are eigen vector centrality of executives (C), directors (D), and shareholders (S); betC, betD, and betS are the betweenness centrality of executives (C), directors (D), and shareholders (S); clusC, clusD, and clusS are clustering coefficient of executives (C), directors (D), and shareholders (S); dirBC, dirBD, and dirBD are the direct bankruptcy rate of executives (C), directors (D), and shareholders (S); and the last: indBC, indBD, and indBS are the indirect bankruptcy rate of executives (C), directors (D), and shareholders (S). All of the variables are computed using Equation (1) to Equation (8).
Table 1 presents the statistical values of these variables. In the final period of 2019, the number of nodes in each network was 450 for executives, 231 for directors, and 399 for shareholders. The description indicates that the shareholder is associated with the highest average value of the variable. This signifies that the shareholder network has edges with values greater than those of the other two networks. This aligns with the density of the shareholder network, as illustrated in Figure 4.
The second-order network is the executive or commissioner network, exhibiting higher mean values for six out of seven variables compared to the director network, with the exception of eigenvalue centrality. The value of weighted-degree centrality ranges from 1 to 214, in contrast to other network variables that have a maximum value of 1. The weighted degree of centrality is multiplied by the weight of each edge, representing the number of executives, directors, or shareholders connecting the nodes. The direct and indirect bankruptcy rates are computed by multiplying the weight of each edge by the respective bankruptcy rates of executives, directors, and shareholders, resulting in a range from zero to hundreds. The indirect bankruptcy rate is elevated due to the extensive indirect connections that the node owns, particularly within the shareholder network. In a director network with many isolated networks, the value of undirected connections between nodes is minimal, indicating a correspondingly low undirected bankruptcy rate.
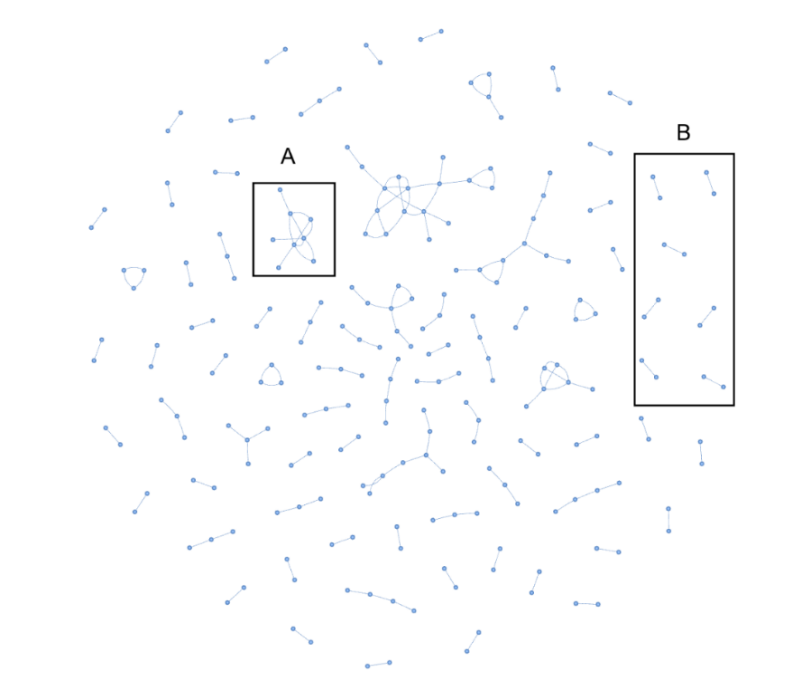
Figure 3 Network of directors. Inset A: conglomerate or group of various sectors. Inset B: Two companies in single sector
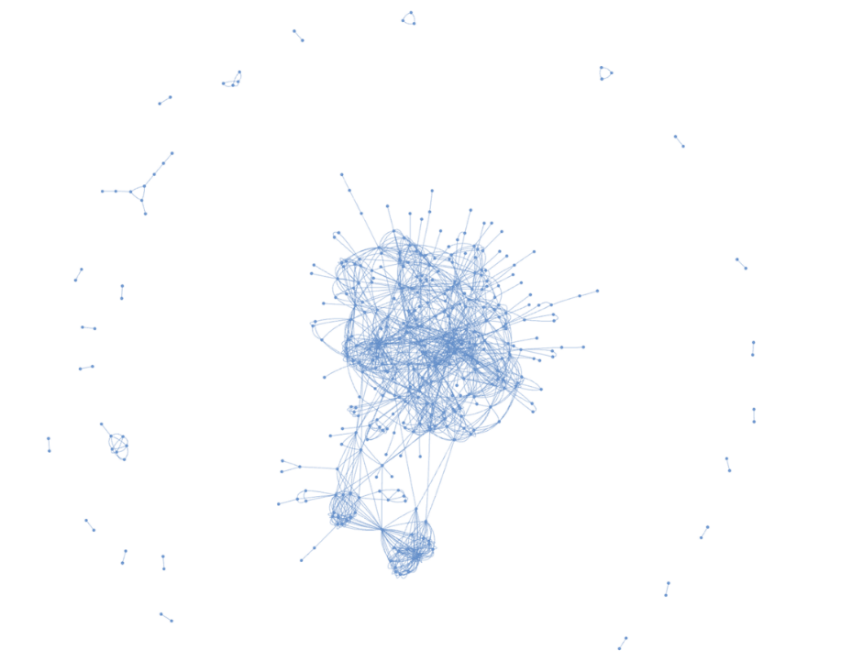
Figure 4 Network of shareholders
Table 1 Descriptive Statistics of Network Variables
Note: N is a number of data; Std.Dev is the standard deviation of data; P25, P50, and P75 are the first, second, and third quartiles of data, respectively
Analyzing the varying average values of a certain variable across each class in Figure 5 reveals that this variable may outline the boundaries between classes. The notable discrepancies are demonstrated by the strength or weighted degree of centrality of shareholders and the direct bankruptcy rates of all entities. The strength or weighted degree of centrality between the true and false classes illustrates the disparities in the shareholder network but not in the other two networks. The mean value of the direct bankruptcy rate between the two classes shows a distinct boundary, while the indirect bankruptcy rate lacks such a delineation. The average direct bankruptcy rates for executives, directors, and shareholders reflect substantial gaps between the two categories. Thus, using two examples of average values, we can conclude that the weighted degree of centrality and the direct bankruptcy rate might serve as separators of healthy firms.
The regression analysis findings for the dependent variable for the data year (Y), one year ahead (Y+1), and two years ahead (Y+2) are presented in Table 2, with the number of observations being 5185, 5104, and 4964, respectively. The regression analysis reveals that the constant variable is significant (P>|z| = 0.000), suggesting a substantial baseline level of financial distress exists even when all the predictors are set to zero. All models yield a nonrobust and convergent outcome. Three distinct models are executed based on the selected features utilized. The model variables that consistently demonstrate significance across three different dependent variables include the degree centrality of directors, the direct bankruptcy rate of executives, and the direct bankruptcy rate of directors. The direct bankruptcy rate of shareholders is noted solely in Y+1. The degree of centrality and the strength of shareholders are observed only in Y+2. The betweenness of shareholders and the indirect bankruptcy rate of executives and shareholders are evident for Y+1 and Y+2.
In the model utilizing Recursive Feature Elimination (RFE), the degree centrality of directors, the clustering coefficient of shareholders, and the direct bankruptcy rate of executives and directors are important in two out of three models. Through elastic network feature selection, we ascertain that the strength of directors, the direct bankruptcy rate of executives and directors, and the indirect bankruptcy rate of executives and shareholders are key variables in forecasting distress.
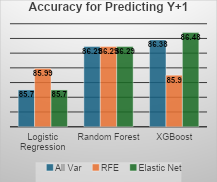
Figure 6 presents the accuracy of our predictions utilizing three different models: logistic regression, Random Forest, and XGBoost. The logistic regression model attains an accuracy of approximately 86% in predicting outcomes one year in advance. It is crucial to acknowledge that our data are imbalanced. The model achieves an accuracy of approximately 83% for forecasts made two years ahead. We employ random forest and XGBoost models to assess predictive performance, given their established efficacy in handling complex data and delivering reliable results. Elastic net feature selection enhances XGBoost, achieving a peak accuracy of 86.48% for predicting Y+1, and 83.18% for predicting Y+2 when employing all variables.
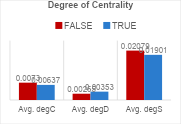
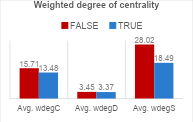
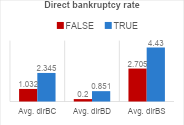
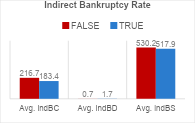
Figure 5 Level of Class Differences of Variable’s Average Value. (a) Degree of Centrality (b) Weighted Degree of Centrality (c) Direct Bankruptcy Rate (d) Indirect Bankruptcy Rate
Table 2 Significance Analysis using Regression
Note: Statistically significant at the 0.05 level; Model Y denotes the dependent variable for the year of data; Model Y+1 represents the dependent variable for one year ahead; Y+2 indicates the dependent variable for two years head; All Var. refers to all 21 variables; RFE indicates the application of Recursive Feature Elimination; Elastic pertains to the use of elastic net feature selection

(a) (b)
Figure 6 Accuracy Result of (a) predicting one year ahead and (b) two years ahead
The results indicate a promising variable for predicting financial distress and demonstrate a systemic effect using only non-financial variables. The network itself can demonstrate the relationships and their impact on a company’s neighborhood. The ultimate ownership theory applies not only to shareholders but also to directors and executives, as proven by the established network in this study.
This research reveals that certain network variables of directors, executives, and shareholders significantly affect the likelihood of bankruptcy. The degree of centrality of directors and the direct bankruptcy rate of directors and executives are the most critical criteria. Contrary to other research which identifies government shareholders as the ultimate controllers of ownership, our finding suggests that an implicit link between directors and executives may also be present in public enterprises. The result indicates linearity with the ultimate ownership theory, implying that shareholders do not constitute the exclusive type of ownership. The conglomerate may appoint its own person as the director or executive officer with supreme authority in the decision-making process. The proven performance of predictable capability has previously been confirmed.
A future study may examine ownership types, such as state-owned enterprises which have been analyzed to have institutional pressure. It will involve identifying and verifying conglomerates within the network and assessing the implications of their belonging on bankruptcy risk. In addition, a hypothetical approach using statistical evidence will be conducted to assess the influence of the ultimate ownership networks on bankruptcy and systemic risk.
Part of this work was supported by the Universitas Indonesia [grant numbers NKB-3228/UN2.RST/HKP.05.00/2020, 2020] and Erasmus+ Mobility Program KA171. Author Contributions Dyah Rahayu: writing - original draft; formal analysis; methodology. Zaa?fri Husodo: conceptualization; methodology; validation; Jan Pidanic: funding acquisition; writing - review & editing. Xue Li: validation; writing - review & editing. Heru Suhartanto: funding acquisition; conceptualization; supervision. Conflict of Interest The authors declare no conflicts of interest.
Abbassi, W, Hunjra, AI, Alawi, SM & Mehmood, R 2021, 'The role of ownership structure and board characteristics in stock market liquidity', International Journal of Financial Studies, vol. 9, no. 4, https://doi.org/10.3390/ijfs9040074
Ahmad, AH 2019, 'What factors discriminate reorganized and delisted distressed firms: Evidence from Malaysia', Finance Research Letters, vol. 29, pp. 50-56, https://doi.org/10.1016/j.frl.2019.03.010
Al-Ward, H, Tan, CK & Lim, WH 2022, 'Caching transient data in Information-Centric Internet-of-Things (IC-IoT) networks: A survey', Journal of Network and Computer Applications, vol. 206, https://doi.org/10.1016/j.jnca.2022.103491
Anghel, DG & Caraiani, P 2024, 'The volatility connectedness of US industries: The role of investor sentiment', Economics Letters, vol. 235, article 111578, https://doi.org/10.1016/j.econlet.2024.111578
Attig, N, Chen, R, El Ghoul, S, Guedhami, O, Kwok, C & Pittman, J 2020, 'Are insiders equal? Evidence from earnings management in closely held East Asian firms', Research in International Business and Finance, vol. 54, https://doi.org/10.1016/j.ribaf.2020.101243
Azar, J, Raina, S & Schmalz, M 2022, 'Ultimate ownership and bank competition', Financial Management, vol. 51, no. 1, pp. 227-269, https://doi.org/10.1111/fima.12368
Bahl, A, Hellack, B, Balas, M, Dinischiotu, A, Wiemann, M, Brinkmann, J, Luch, A, Renard, BY & Haase, A 2019, 'Recursive feature elimination in random forest classification supports nanomaterial grouping', NanoImpact, vol. 15, https://doi.org/10.1016/j.impact.2019.100179
Ben Jabeur, S 2017, 'Bankruptcy prediction using Partial Least Squares Logistic Regression', Journal of Retailing and Consumer Services, vol. 36, pp. 197-202, https://doi.org/10.1016/j.jretconser.2017.02.005
Carmona, P, Climent, F & Momparler, A 2018, 'Predicting failure in the U.S. banking sector: An extreme gradient boosting approach', International Review of Economics and Finance, March, pp. 1-20, https://doi.org/10.1016/j.iref.2018.03.008
Charalambous, C, Martzoukos, SH & Taoushianis, Z 2023, 'A neuro-structural framework for bankruptcy prediction', Quantitative Finance, vol. 23, no. 10, pp. 1445-1464, https://doi.org/10.1080/14697688.2023.2230241
Chen, TK, Liao, HH, Chen, GD, Kang, WH & Lin, YC 2023, 'Bankruptcy prediction using machine learning models with the text-based communicative value of annual reports', Expert Systems with Applications, vol. 233, https://doi.org/10.1016/j.eswa.2023.120714
Cheng, X, Shaoyi, LS & Hua, Z 2017, 'Measuring the systemic importance of interconnected industries in the world economic system', Industrial Management and Data Systems, vol. 117, no. 1, pp. 110-130, https://doi.org/10.1108/IMDS-10-2015-0442
Diebold, FX & Y?lmaz, K 2023, 'Reprint of: On the network topology of variance decompositions: Measuring the connectedness of financial firms', Journal of Econometrics, vol. 234, pp. 70-90, https://doi.org/10.1016/j.jeconom.2023.03.003
Dong, W, Dong, X & Lv, X 2022, 'How does ownership structure affect corporate environmental responsibility? Evidence from the manufacturing sector in China', Energy Economics, vol. 112, https://doi.org/10.1016/j.eneco.2022.106112
Eremina, I & Rodionov, D 2023, 'The Special Aspects of Devising a Methodology for Predicting Economic Indicators in the Context of Situational Response to Digital Transformation', International Journal of Technology, vol. 14, no. 8, pp. 1653-1662, https://doi.org/10.14716/ijtech.v14i8.6839
Firdausiah Mansur, AB, Yusof, N & Basori, AH 2017, 'Comprehensive analysis of Student’s Academic Failure Classification through Role-Sphere Influence and Flow betwenness centrality', Procedia Computer Science, vol. 116, pp. 509-515, https://doi.org/10.1016/j.procs.2017.10.031
Hagberg, AA, Los, I, Schult, DA & Swart, PJ 2008, 'Exploring Network Structure, Dynamics, and Function using NetworkX', SciPy Conference 2008 Proceedings, http://conference.scipy.org/proceedings/SciPy2008/paper_2
Hansen, DL, Shneiderman, B & Smith, MA 2011, 'Part I. Getting Started with Analyzing Social Media Networks', in Analyzing Social Media Networks with NodeXL, https://doi.org/10.1016/B978-0-12-382229-1.00016-3
Ivashina, V, Iverson, B & Smith, DC 2016, 'The ownership and trading of debt claims in Chapter 11 restructurings', Journal of Financial Economics, vol. 119, no. 2, pp. 316-335, https://doi.org/10.1016/j.jfineco.2015.09.002
Kamei, H, Takayasu, H, Kabashima, Y & Takayasu, M 2017, 'Bankruptcy Prediction with Interfirm Network Structure', https://doi.org/10.7566/jpscp.16.011013
Kanapickien?, R, Kanapickas, T & Ne?i?nas, A 2023, 'Bankruptcy Prediction for Micro and Small Enterprises Using Financial, Non-Financial, Business Sector and Macroeconomic Variables: The Case of the Lithuanian Construction Sector', Risks, vol. 11, no. 5, https://doi.org/10.3390/risks11050097
Kang, CM, Wang, MC & Lin, L 2022, 'Financial Distress Prediction of Cooperative Financial Institutions—Evidence for Taiwan Credit Unions', International Journal of Financial Studies, vol. 10, no. 2, https://doi.org/10.3390/ijfs10020030
Kong, X, Shi, Y, Yu, S, Liu, J & Xia, F 2019, 'Academic social networks: Modeling, analysis, mining and applications', Journal of Network and Computer Applications, vol. 132, pp. 86-103, https://doi.org/10.1016/j.jnca.2019.01.029
Köster, H & Pelster, M 2018, 'Financial penalties and banks’ systemic risk', Journal of Risk Finance, vol. 19, no. 2, pp. 154-173, https://doi.org/10.1108/JRF-04-2017-0069
Li, H & Sun, J 2011, 'Predicting business failure using forward ranking-order case-based reasoning', Expert Systems with Applications, vol. 38, no. 4, pp. 3075-3084, https://doi.org/10.1016/j.eswa.2010.08.098
Li, Z, Crook, J & Andreeva, G 2014, 'Chinese companies distress prediction: An application of data envelopment analysis', Journal of the Operational Research Society, vol. 65, no. 3, pp. 466-479, https://doi.org/10.1057/jors.2013.67
Li, Z, Crook, J, Andreeva, G & Tang, Y 2021, 'Predicting the risk of financial distress using corporate governance measures', Pacific Basin Finance Journal, vol. 68, https://doi.org/10.1016/j.pacfin.2020.101334
Ma’ruf, A, Nasution, AAR & Leuveano, RAC 2024, 'Machine Learning Approach for Early Assembly Design Cost Estimation: A Case from Make-to-Order Manufacturing Industry', International Journal of Technology, vol. 15, no. 4, p. 1037, https://doi.org/10.14716/ijtech.v15i4.5675
Neff, T & Benson, R 2021, 'News You Can Use to Promote Your Interests: Media Ownership Forms and Economic Instrumentalism', Journalism Studies, vol. 22, no. 15, pp. 2103-2121, https://doi.org/10.1080/1461670X.2021.1986115
Nie, Z, Yan, L, Wang, Z & Li, B 2023, 'Disclosure delay and financial distress prediction: based on Chinese annual reports disclosure system', Applied Economics Letters, vol. 30, no. 15, pp. 2098-2101, https://doi.org/10.1080/13504851.2022.2094314
Papík, M & Papíková, L 2023, 'Impacts of crisis on SME bankruptcy prediction models’ performance', Expert Systems with Applications, vol. 214, https://doi.org/10.1016/j.eswa.2022.119072
Ragab, YM & Saleh, MA 2022, 'Non-financial variables related to governance and financial distress prediction in SMEs-evidence from Egypt', Journal of Applied Accounting Research, vol. 23, no. 3, pp. 604-627, https://doi.org/10.1108/JAAR-02-2021-0025
Rahayu, DS & Suhartanto, H 2020, 'Ensemble Learning in Predicting Financial Distress of Indonesian Public Company', 2020 8th International Conference on Information and Communication Technology (ICoICT), pp. 1-5, https://doi.org/10.1109/ICoICT49345.2020.9166246
Romahadi, D, Feleke, AG & Youlia, RP 2024, 'Evaluation of laplacian spatial filter implementation in detecting driver vigilance with linear classifier', International Journal of Technology, vol. 15(6), pp. 1712-1729, https://doi.org/10.14716/ijtech.v15i6.7166
Shetty, S, Musa, M & Brédart, X 2022, 'Bankruptcy Prediction Using Machine Learning Techniques', Journal of Risk and Financial Management, vol. 15, no. 1, https://doi.org/10.3390/jrfm15010035
Shkarupeta, E, Babkin, A, Palash, S, Syshchikova, E & Babenyshev, S 2024, 'Economic security management in regions with weak economies in the conditions of digital transformation', International Journal of Technology, vol. 15(4), pp. 1183-1193, https://doi.org/10.14716/ijtech.v15i4.6838
Sun, Y, Han, J, Zhao, P, Yin, Z, Cheng, H & Wu, T 2009a, 'RankClus', Proceedings of the 12th International Conference on Extending Database Technology: Advances in Database Technology, pp. 565-576, https://doi.org/10.1145/1516360.1516426
Sun, Y, Yu, Y & Han, J 2009b, 'Ranking-based clustering of heterogeneous information networks with star network schema', Proceedings of the 15th ACM SIGKDD International Conference on Knowledge Discovery and Data Mining, pp. 797-806, https://doi.org/10.1145/1557019.1557107
Tobback, E, Bellotti, T, Moeyersoms, J, Stankova, M & Martens, D 2017, 'Bankruptcy prediction for SMEs using relational data', Decision Support Systems, vol. 102, pp. 69-81, https://doi.org/10.1016/j.dss.2017.07.004
Ulyah, SM, Susanti, R, Andreas, C, Rahmayanti, IA, Rifada, M, Fitriyani, NL & Ana, E 2024, 'A Multivariate Regression with Time Series Error in Forecasting Jakarta Composite Index and Stock Prices of Banking Industry in Indonesia by Considering COVID-19 Effect', International Journal of Technology, vol. 15, no. 6, p. 1839, https://doi.org/10.14716/ijtech.v15i6.5469
Vivandari, A & Fitriany, F 2019, 'Impact of Ultimate Ownership Type on Audit Fees with Corporate Governance as Moderating Variable', Proceedings of the 3rd Asia-Pacific Research in Social Sciences and Humanities Universitas Indonesia Conference (APRISH 2018), https://doi.org/10.2991/aprish-18.2019.31
Wang, P, Wang, F & Hu, N 2018, 'The Effect of Ultimate Ownership on the Disclosure of Environmental Information', Australian Accounting Review, vol. 28, no. 2, pp. 186-198, https://doi.org/10.1111/auar.12166
Wang, Z, Wang, Q, Nie, Z & Li, B 2022, 'Corporate financial distress prediction based on controlling shareholder’s equity pledge', Applied Economics Letters, vol. 29, no. 15, pp. 1365-1368, https://doi.org/10.1080/13504851.2021.1931656
Wihlborg, C 2018, 'Systemic risk and the organization of the financial system: overview', Journal of Financial Economic Policy, vol. 10, no. 2, pp. 202-212, https://doi.org/10.1108/JFEP-02-2018-0021
Wu, D, Ma, X & Olson, DL 2022, 'Financial distress prediction using integrated Z-score and multilayer perceptron neural networks', Decision Support Systems, vol. 159, https://doi.org/10.1016/j.dss.2022.113814
Yin, H, Zhang, L & Zhang, Y 2017, 'The effect of ownership concentration and related diversification strategy of entrepreneurial enterprises on enterprise performance', Eurasia Journal of Mathematics, Science and Technology Education, vol. 13, no. 12, pp. 8073-8087, https://doi.org/10.12973/ejmste/78101
Zhao, J, Ouenniche, J & De Smedt, J 2024, 'A complex network analysis approach to bankruptcy prediction using company relational information-based drivers', Knowledge-Based Systems, vol. 300, https://doi.org/10.1016/j.knosys.2024.112234
Zhong, LF, Shang, MS, Chen, XL & Cai, SM 2018, 'Identifying the influential nodes via eigen-centrality from the differences and similarities of structure', Physica A: Statistical Mechanics and Its Applications, vol. 510, pp. 77-82, https://doi.org/10.1016/j.physa.2018.06.115