Methodology for Substantiating the Characteristics of Safety Indicators Dependency on the Parameters of Urban Environment Infrastructure
Corresponding email: talipova_lv@spbstu.ru
Published at : 17 Jul 2025
Volume : IJtech
Vol 16, No 4 (2025)
DOI : https://doi.org/10.14716/ijtech.v16i4.7414
Talipova, L, Radaev, A, Morozova, E, Skhvediani, A & Efremov, A 2025, ‘Methodology for substantiating the characteristics of safety indicators dependency on the parameters of urban environment infrastructure’, International Journal of Technology, vol. 16, no. 4, pp. 1154-1166
| Liliia Talipova | Peter the Great St.Petersburg Polytechnic University, 195251, St.Petersburg, Russia |
| Anton Radaev | Peter the Great St.Petersburg Polytechnic University, 195251, St.Petersburg, Russia |
| Evangelina Morozova | Peter the Great St.Petersburg Polytechnic University, 195251, St.Petersburg, Russia |
| Angi Skhvediani | Peter the Great St.Petersburg Polytechnic University, 195251, St.Petersburg, Russia |
| Andrei Efremov | Belarusian State University of Informatics and Radioelectronics, 6 Brovki Street, 220013, Minsk, Belarus |

This study aimed to investigate the relationships between road safety indicators and urban environment infrastructure parameters. The analysis focused on how infrastructure influenced road safety outcomes. To achieve the objective, a methodology using nonlinear optimization tools was developed to substantiate the relationships and provide a more nuanced understanding of their characteristics. This methodology was tested and validated using St. Petersburg as a case study, with metro stations as the focus of analysis. Subsequently, methodology was applied to simulate 20677 pedestrian accident between 2018 and 2023. The results showed that there were 7 distinct clusters based on the specific relationships between the probability of road accident and the infrastructure characteristics of the surrounding areas. The dependency type of each cluster was carefully analyzed and justified, showing the unique characteristics of the urban environment around the selected focal points. The results showed significant variations in safety dependency based on different urban infrastructure characteristics. This innovative methodology has practical applications for specialist government agencies in St. Petersburg, providing a robust framework for developing targeted interventions and strategies to improve road safety in urban areas.
Nonlinear optimization; Road accident; Safety; Urban environment; Urban infrastructure
Annually, there is a significant increase in the number of scientific studies investigating the nature of road accident in different territories (Chand et al., 2021). These studies explore factors affecting the occurrence of severe road accident, methodology to minimize their concentration, and measures to increase safety (Geremew, 2024; Zhou et al., 2019; Lyu et al., 2018; Behnood and Mannering, 2017). The application of geoinformation system (GIS), spatial (road segment and intersection, zonal, regional, conditional approaches), and machine learning in road safety have gained wide attention (Ziakopoulos and Yannis, 2020; Gutman et al., 2021). However, previous studies have only focused on separate aspects of road safety and urban planning. This shows the need to develop a complex methodology, which integrates the tools and procedures for the purpose of road accident concentration hotspot identification and the development of incentives to increase safety. Therefore, investigations are carried out to explore the distribution of accident severity and problems of prediction, the influence of infrastructure, and the impact of accident types on mortality.
Studies by (Ciprian-Sorin et al., 2024; Orsini et al., 2019) have examined the distribution of road accident severity to determine the causes of injuries to users and recommend proposals to reduce the severe and fatal consequences of road accident. The results showed the distribution of severity, predominantly consisted of minor cases, and fatal accident was the least common. Therefore, predicting fatal cases can be difficult due to the small number of observations in the sample compared to the mild and moderate severity (Sakib et al., 2024; Ahmed et al., 2023).
Papadimitriou and Theofilatos (2017) have shown the distribution of road accident severity, ranging from light as the most common, to fatal cases which is minimal (Orsini et al., 2019). Therefore, predicting fatal cases may be difficult due to the small number of observations in the sample compared to the mild and moderate severity (Gianfranchi et al., 2017). Major road infrastructure bottlenecks tend to cause more severe injuries after accident (Zeng et al., 2017). This shows the need to determine the cause of injuries and implement a road safety project effectively in terms of reducing the severity in a shorter time.
The impact of road infrastructure deficiency on accident needs to be analyzed. In this context, several studies have focused on the effect of traffic lights, road barriers, and signs on the outcome of road accident (Yevtyukov et al., 2020; Yevtyukov and Golov, 2017). The study by Billah et al., (2021) and Chen et al., (2020) focused on more comprehensive analyses considering the influence of different factors on the severity of road accident, such as lighting (Billah et al., 2021; Chen et al., 2016), weather conditions (Islam et al., 2021), human factors (Onieva-García et al., 2016; Park et al., 2012), and vehicle characteristics (Azhar et al., 2022; Wang et al., 2017). Furthermore Pang et al., (2022), Chen et al., (2020), and Malin et al., (2019) investigated the effect of weather conditions on post-accident mortality, identifying precipitation as a factor increasing the likelihood of more severe accident outcomes. Chen et al., (2020) and Park et al., (2012) also investigated the influence of weather conditions on mortality after road traffic accident. The results showed that precipitation was a factor increasing the likelihood of more serious consequences of road traffic accident. Rifat et al., (2024), Madushani et al., (2024), Rodionova et al., (2022), and Rodionova et al., (2021), have developed a model on the influence of various factors on the severity of injuries sustained in road traffic accident. The most important factor contributing to the increase in the number of fatalities due to the condition of the road infrastructure is the lack of road barriers (2.8%), and infrastructure, such as the lack of road lighting (12.6%). Azhar et al. (2022), Bhuiyan et al. (2022) and Billah et al. (2021) have also explored how different types of road accident can affect mortality rates.
Based on the background above, this study aimed to develop a comprehensive methodology to substantiate the dependencies of safety indicators on urban infrastructure parameters. The analysis focused on addressing the growing need for evidence-based methodology to improve road safety in an increasingly complex urban environment. By understanding the intricate relationships between safety metrics and infrastructure attributes, this study provided valuable contributions to more effective planning and management strategies for urban spaces. In order to achieve the objective, a systematic methodology was adopted that included several key tasks. These included a thorough review and analysis of the existing scientific literature and studies in the field, focusing on substantiating the relationships between road safety indicators and infrastructure characteristics. The analysis was followed by the development of a novel methodology to formalize and validate the relationships. Finally, the practical applicability of the proposed methodology will be shown using St. Petersburg as a case study, providing tangible insights and actionable recommendations applicable to urban agglomerations in Russia. St Petersburg is one of the largest cities in Russia, comprising both well-established buildings of the historic center and the new districts.
The subject of this study is the relationship between road safety indicators and transport infrastructure characteristics. Specifically, analysis is carried out to examine how different characteristics of urban infrastructure affect key safety metrics. The subject delves deeper into the interdependency of safety parameters, providing a focused examination of how urban infrastructure environment affects overall road safety outcomes. This dual focus ensures a comprehensive understanding of both the theoretical and practical dimensions of road safety in urban contexts.
This study is structured as follows, section 2 includes the development of a methodology for characterizing the dependencies of safety performance on the infrastructure of urban environment. The application of GIS to urban environment and road accident data is considered. In section 3, the developed methodology is applied to data from St. Petersburg. Finally, section 4 discusses the general conclusions of the review process and future study directions.
In the intermediate stages of this study, a comprehensive methodology was developed to substantiate and analyze the relationships between safety indicators and urban infrastructure characteristics. This methodology included identifying key variables influencing road safety, such as traffic density, road design, pedestrian accessibility, lighting, and signage. Detailed modeling and statistical analyses were used to establish the relationships, analyzing the impact of specific infrastructure elements on accident frequency and severity.
The methodology included the integration of geoinformation system (GIS) to spatially map the accident data and provide a visual representation of safety hotspots and infrastructure deficiencies. This facilitated the identification of patterns and correlations, such as the effect of road width, intersections, and signal placement on safety outcomes. The methodology also considered temporal factors, such as peak hours and seasonal variations, to ensure a robust analysis. The study by Talipova et al., (2023) and Lazarev et al., (2022), Sa'd et al., (2021) considered the methodology of creating GIS of transport infrastructure objects, defining the classification of objects, the order of collection and processing of raw data, as well as the sequence of data processing for transfer to GIS.
By using the framework, this study provided insights into the direct impact of urban infrastructure on safety indicators. The results also provided a reference for developing targeted interventions and policy recommendations to improve road safety in urban environment.
The developed methodology consisted of the following stages:
1. Obtaining initial data on the urban environment with the help of GIS and data on road accident.
2. Primary data processing. At this stage, a digital model of the urban environment with selected accident data was created.
3. Target points were identified for the analysis of road accident based on the characteristics of pedestrian traffic volume and grouping depending on urban infrastructure parameters. Target points for analysis were objects of attraction to the constant flow of people.
4. Construction of study areas from the target points. The boundaries of study areas were circles with a certain radius and incremental steps minus the previous area.
The maximum radius of the study area around the target points was defined as half of the minimum distance between the target points belonging to different clusters and calculated as follows in Equation 1:

where Rmax is maximum radius for determining the number of accident around the target point; is distance between target points, calculated by Equation 2; K is set of indexes (k) target points ; k (k=1,2,…z) is the target point index.
Each survey area will be taken in equal increments except for the previous area. The incremental step of study area around the centers of attraction can be defined in several ways:
- as the minimum distance between the places of road traffic accident in the analyzed area, in line with Equations 3 and 4;

where  R is step of increasing the radius of accident count area around the target points; is distance between places where accident is concentrated,
  is accident concentration point index ( = 1,2…
 ), is the number of road accident concentration.
- as the average value between the accident areas, based on Equation 5;

- as a weighted average distance between places where road accident occur, depending on the severity of their outcome, as expressed in Equations 6, 7, and 8;


where  R is step of increasing the radius of accident count area around the target points; is weighted distances between the locations where accident is concentrated,
  is the set of accident point indices corresponding to the points of concentration areas
  ( = 1,2…
 ) ; wj is specific designation showing the severity of the accident outcome, j is traffic accident number, n is number of traffic accident.
5. Counting the number of accident in each of the areas relative to each target point as a center of attraction for people and determining the specific indicator of risk at each considered area as a ratio of the obtained number of accident to the permeability of the given centers of attraction of people as Equation 9.
where yi is the specific indicator of the risk of accident of measurement i (i=1,2,…m), m is the number of measurements, i is the index of measurement, Ni the number of accident by measurement i (i=1,2,…m),  is the volume of the flow of people through the target point at the considered time.
6. Approximation results of the number of accident across study areas relative to the target points of each safety group through the influence of infrastructure.
Approximation is a method of estimating mathematical objects by varying based on other values. The approximated function does not through the original nodes, but ‘smooths’ the values (Jittawiriyanukoon and Srisarkun, 2018). This method allows the investigation of numerical characteristics and qualitative properties of an object, reducing the problem to simpler or more convenient objects. The description of initial data and unknown variables is shown in Table 1.
Expression of the approximated function in general form as Equation 10:
In the case of increasing of approximated function, the maximum and minimum predicted value will have the following form of Equations 11 and 12 respectively:
The parameters of forecast models determined in accordance with the paragraphs of Table 1 were formed as part of the optimization procedure using the GRG (Generalized Reduced Gradient) method. In the case of decreasing approximated function, the maximum and minimum predicted value will have the following form of Equations 13 and 14 respectively:
Table 1 Input data and unknown variables

The value of the scale parameter is determined by Equation 15:
The value of the shape parameter is set using the selection method.
The value of the offset parameter is determined by Equation 16:
The sum of squares of forecast deviations for indicator from actual values is determined using Equation 17:
The coefficient of determination is determined using Equation 18. This is the reliability value of approximation.

where R2 is sum of average deviation from actual values.
The coefficient of determination is the reliability value of approximation, where value close to 1 is considered better. For acceptable models, R2 is greater than 0.5. Models with a coefficient of determination greater than 0.7 can be considered good enough. Moreover, minimality of differences between the initial and approximated function is determined by the sum of squares of initial deviation and forecast values.
The target function has the form Equation 19:
7. Processing and analyzing the results. At this stage, the effect of created travel safety conditions was determined and general recommendations were formulated. Figure 1 shows a flowchart of the described methodology.
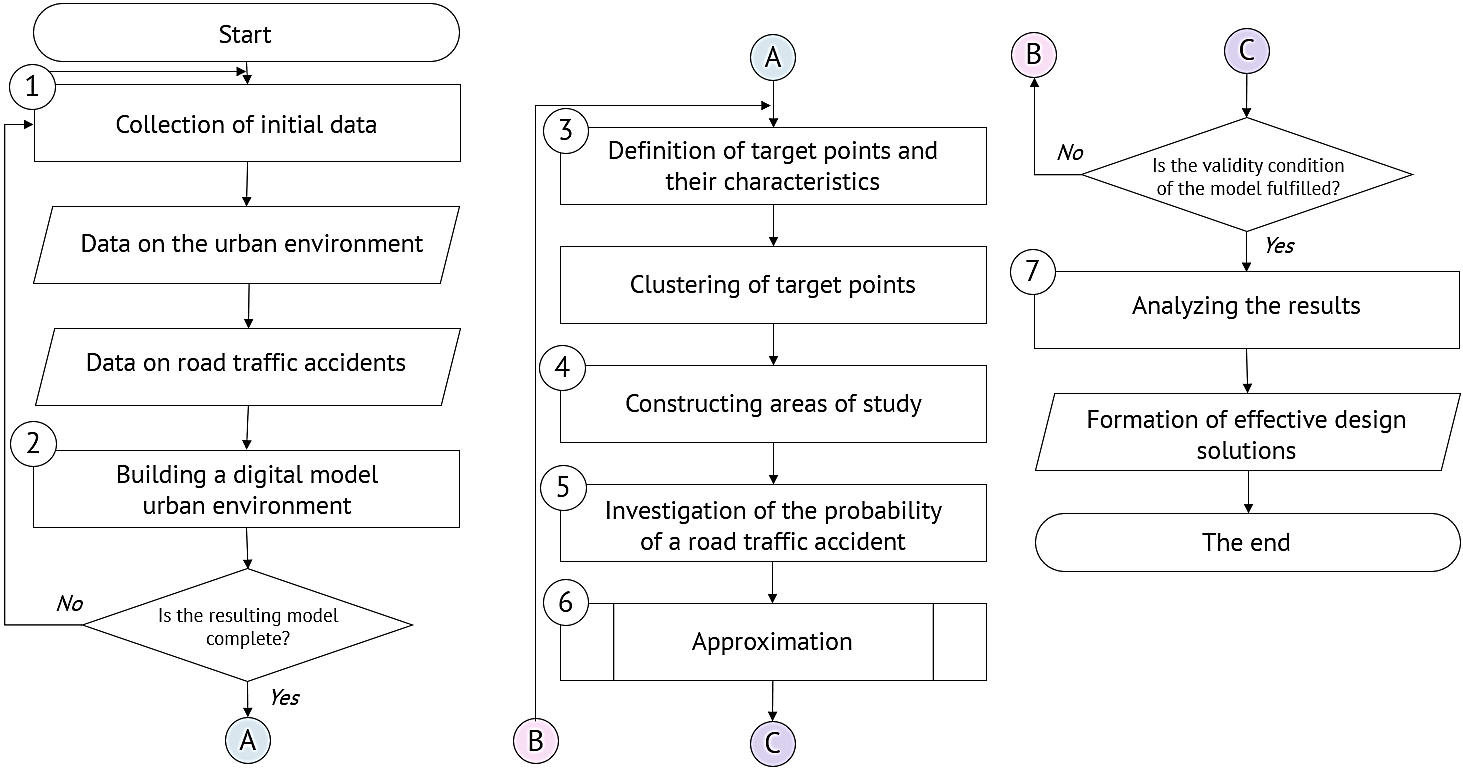
Figure 1 Methodology for substantiating the characteristics of safety indicators dependency on the parameters of the urban environment infrastructure
In the final stages, the methodology was implemented on the example of St. Petersburg. For the construction of urban environment, the software product QGIS was adopted. QGIS served as an open-source GIS, which provided an opportunity to work with different types of geographic data in various formats and projections without converting to a common format.
Based on the data obtained from QGIS, an algorithm was created in Grasshopper environment to identify the dependency of accident on the safety measures created around pedestrian hotspots. The data on buildings, roads, and traffic accident were in vector format, representing geographic data with attribute information. Furthermore, Grasshopper environment was considered optimal for working with data of different formats. Geometry is transferred to the Grasshopper visual programming environment in vector format (Figure 2).
In this study, pedestrian safety was analyzed and cases were selected based on the structure of accident data. Subsequently, data on accident with the considered composition of participants was sampled.
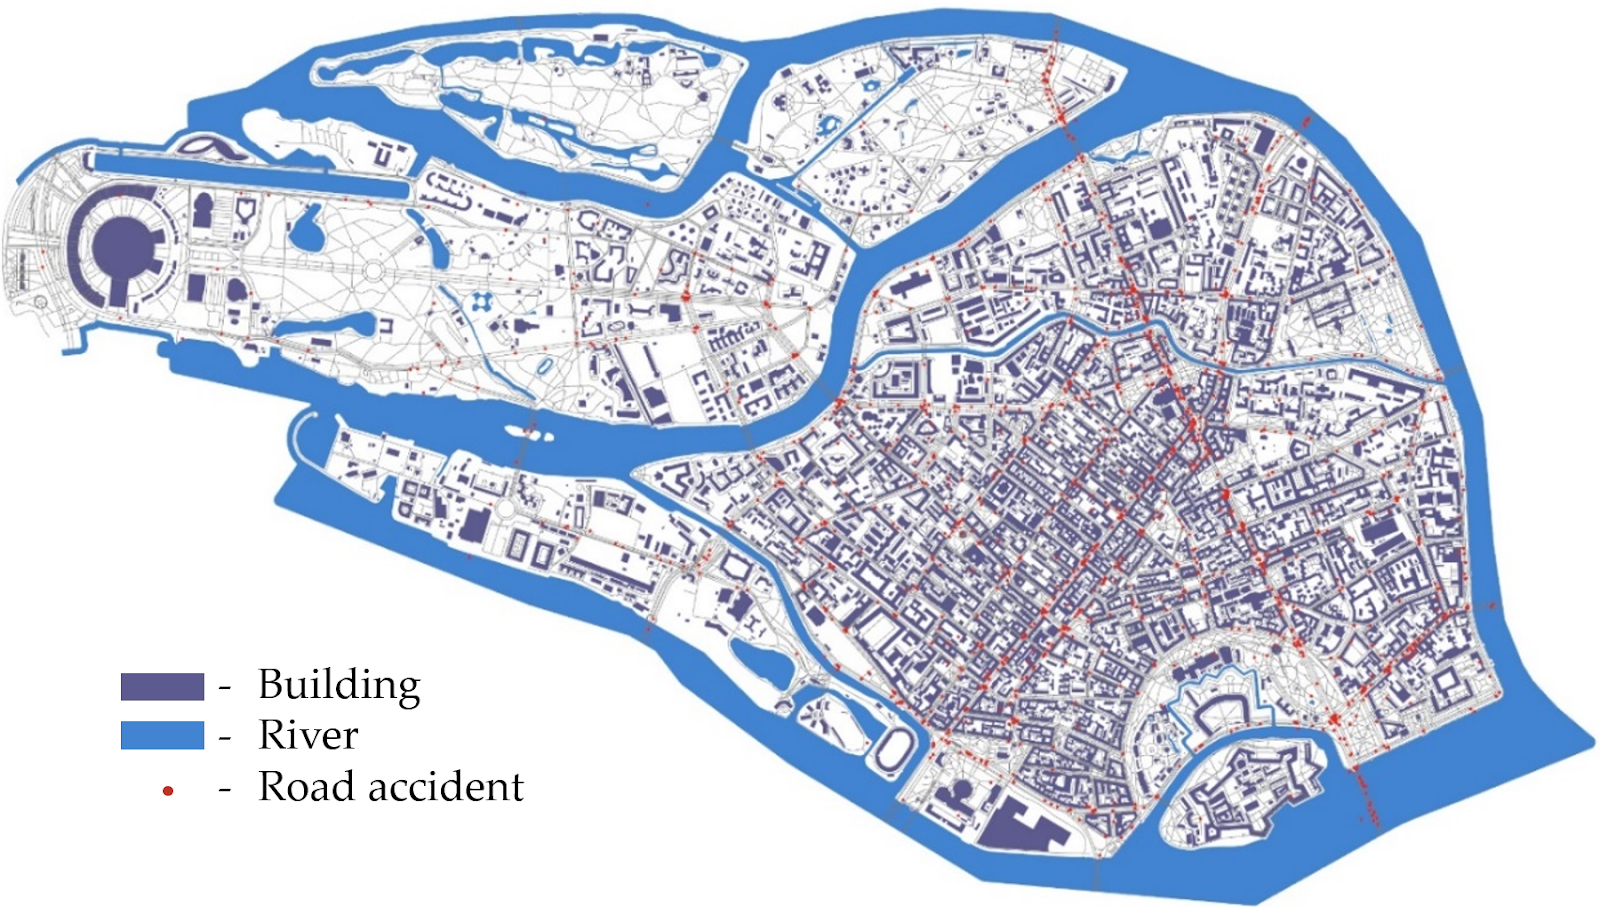
Figure 2 View of Petrogradsky district of St. Petersburg in Rhino/Grasshopper environment with data on buildings, roads, rivers, and traffic accident
Pedestrian crossing infrastructure had a direct impact on the safety of people flow in urban environment. This is because pedestrian crossings could be underground and elevated. In this study, the type of pedestrian crossing was an indicator of infrastructure that affected the safety of people flow. Metro stations were divided into 2 groups based on the presence of underpass in the immediate vicinity. The volume of people flowing in the center of the attraction was defined as the passenger flow of the station during the analysis period (2018 - 2023). Based on the analysis, the step area of traffic accident count was considered as the average value between the traffic accident occurrence areas:

In St. Petersburg, the closest metro stations without underground crossings were identified to be Vladimirskaya and Ploshchad Vosstaniya, with a distance of 800 m. Therefore, the maximum radius of determining the number of accident around the metro station, determined by Equations 1 and 2 was R max = 400 m. The created algorithm in Grasshopper environment allowed to automatically calculate the number of traffic accident by areas according to the specified target points (metro stations). In this algorithm, the division of accident analysis areas was presented with steps of 80 m from the target point. Subsequently, the circles of analysis areas were plotted, and traffic accident was counted according to the given parameters (Figure 3).
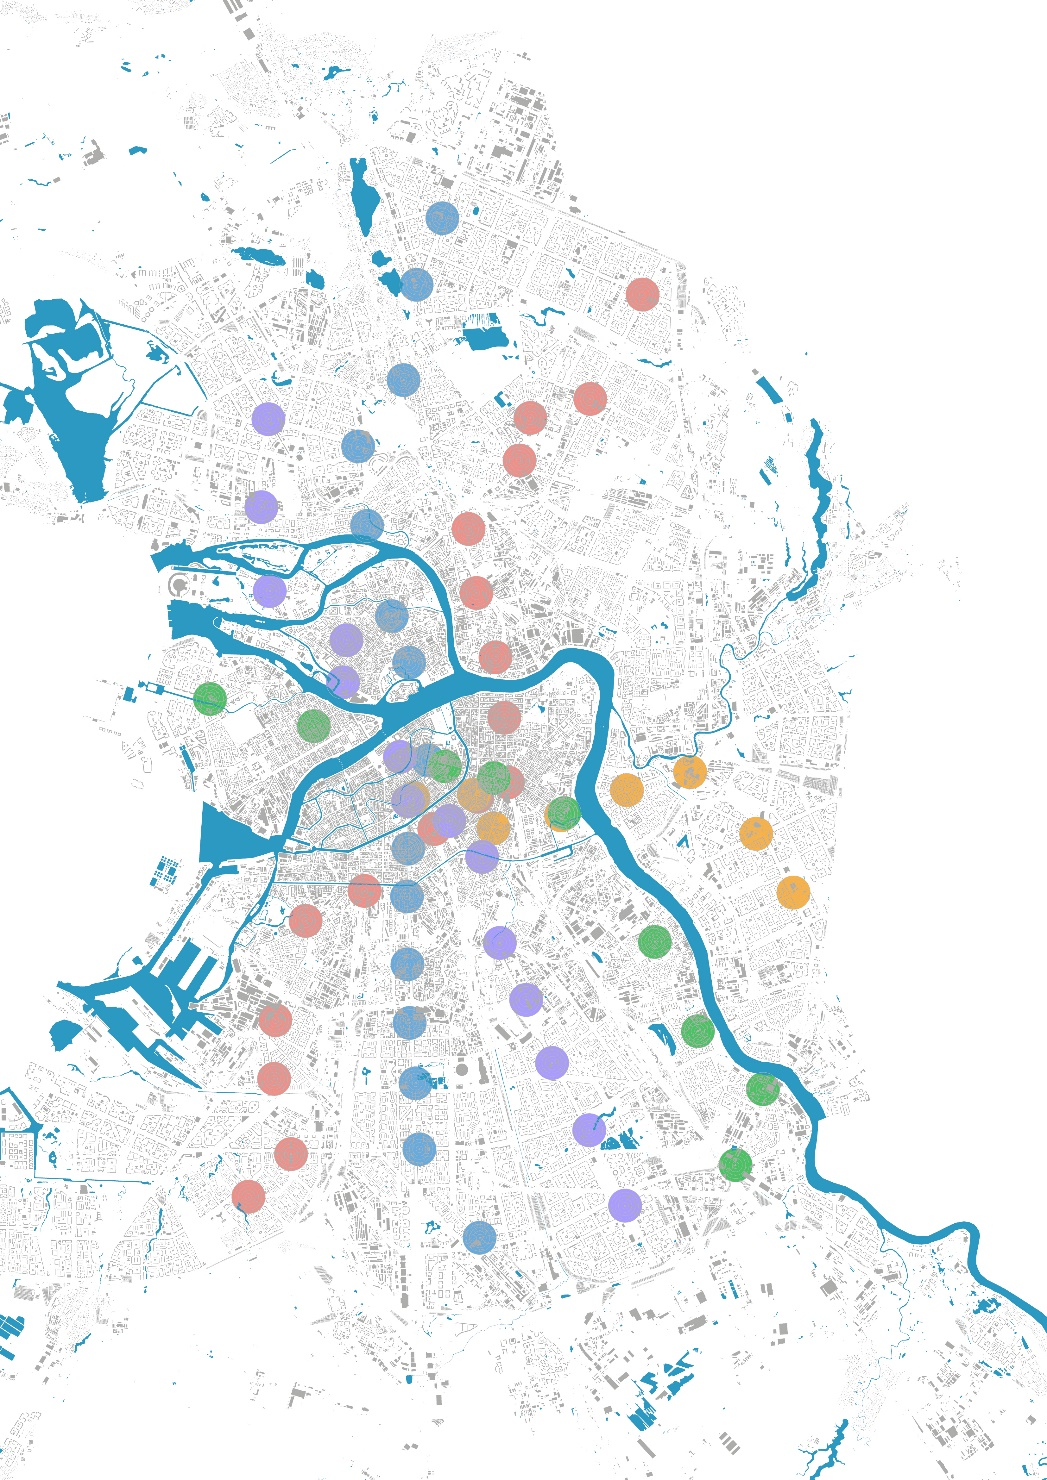
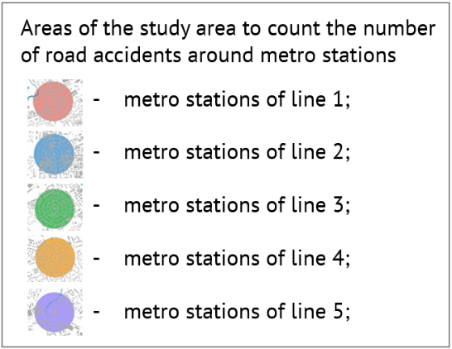
Figure 3 Construction of accident analysis areas around the target points
The algorithm identified accident in each area separately and counted their number. Based on the results, the specific coefficient of probability of accident occurrence was calculated according to Equation 9. The approximation process, defined by the expressions Equation 10 - Equation 19, was performed in Microsoft Excel using the 'Solution Finding' add-in in accordance with the mathematical description of the model. The target cell and the type of optimization were defined according to Equation 19. Subsequently, the approximated graphs, showing the distribution of specific indicators of road accident probability per 100 million inhabitants were summarized by clusters in Figure 4. These clusters were formed based on similar types of dependency and the composition was indicated in the legend of the corresponding graphs.
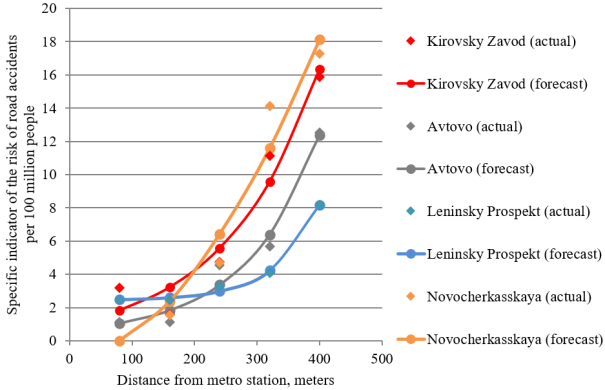
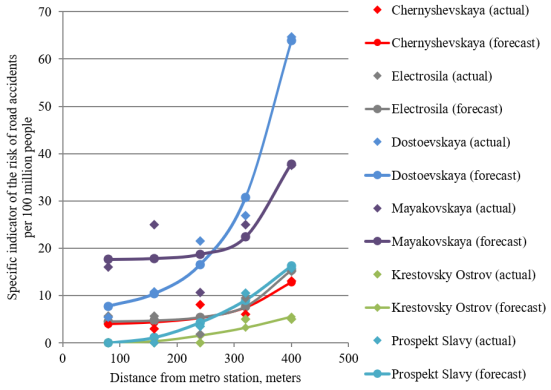
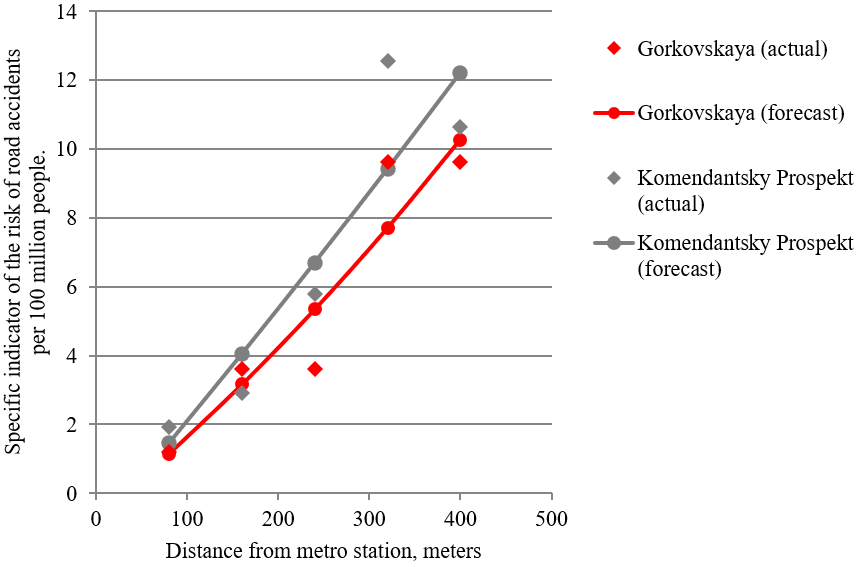
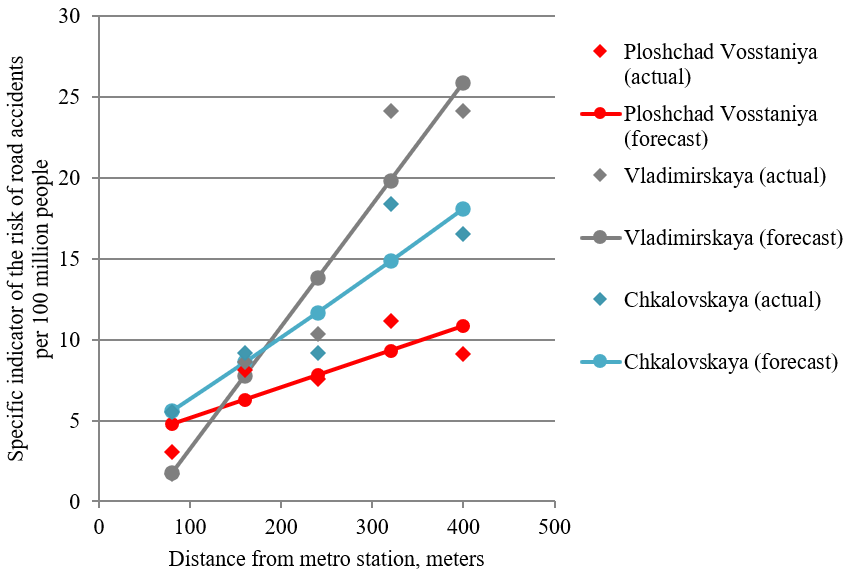
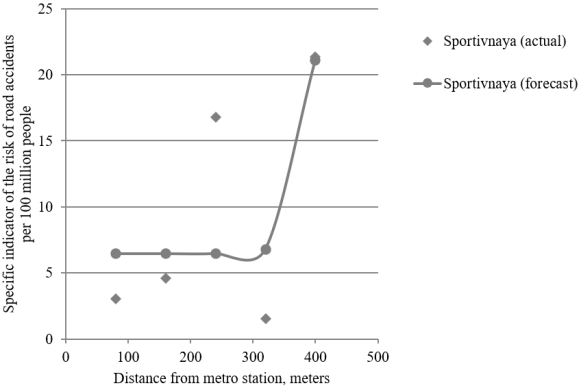
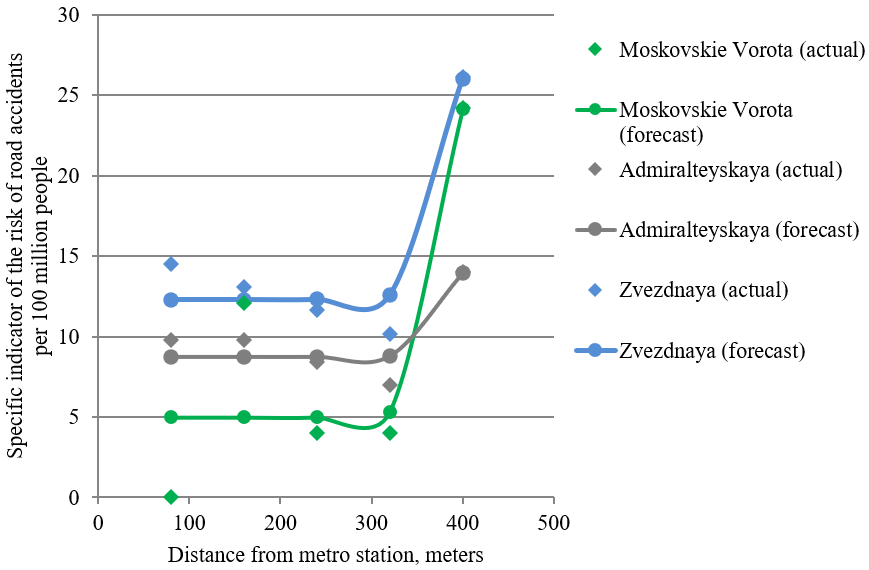
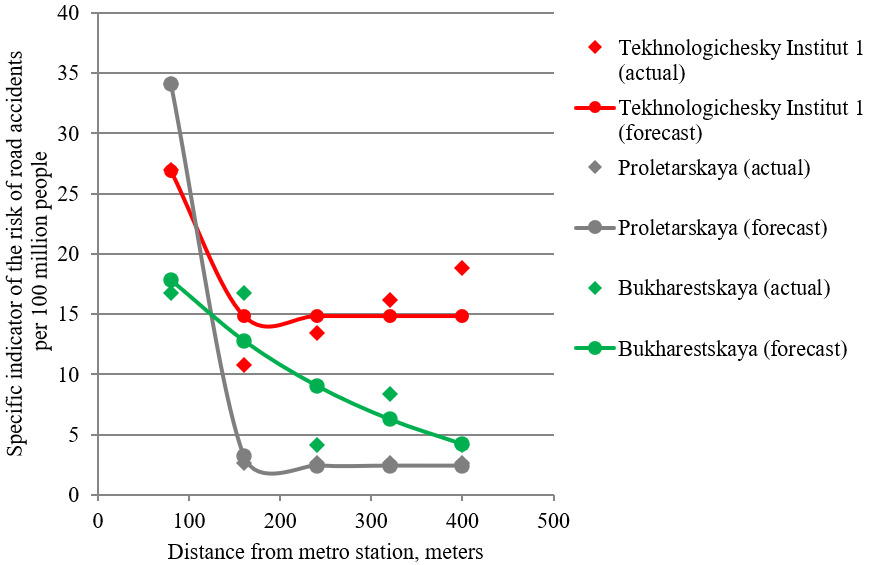
Figure 4 Approximated graphs of the distribution of the specific probability of road accident per 100 million people. a- Underground crossings are located close to the metro. There is relatively free urban development around the target points, b - only above-ground pedestrian crossings are located near the stations. There is dense urban development around the stations, and c - underground pedestrian crossings are located next to underground exits. The exits are directed to the avenues., d - only above-ground pedestrian crossings are located near the stations. Metro exits are directed to avenues. e - underground pedestrian crossings are located next to underground exits. Exits are remote from highways. f - only above-ground pedestrian crossings are located near the stations. Exits are remote from thoroughfares. g - only ground pedestrian crossings are located near the stations. There are tram stops near the exits
The studies by Hee et al. (2024), Wang et al. (2022), and Dushkin et al. (2021) have provided an in-depth analysis of the multiple interactions between road users, including vehicles, infrastructure elements, pedestrians, and other participants in the traffic ecosystem. The results showed the critical need for innovative traffic management methodology extending beyond the automation of existing strategy. This proposed methodology showed the potential for transformative improvements in road safety and transport efficiency, serving as a continuation of previous study to explore the intricate relationships between road accident and urban infrastructure. By analyzing these relationships, the study aimed to identify how specific infrastructure characteristics influence the occurrence and severity of accident. The results showed a clear correlation between urban infrastructure parameters and road environment safety indicators.
The results validated the effectiveness of the developed toolkit in capturing dependency, suggesting its high practical relevance. This methodology framework not only advanced theoretical understanding but also provided actionable insights for urban planners, policymakers, and engineers seeking to improve road safety and optimize transport systems. Therefore, the study provided a robust basis for implementing data-driven improvements in traffic management on the unique characteristics of different urban environment.
In conclusion, this study applies methodology to simulate 20677 pedestrian accident between 2018 and 2023. Using approximation tools, 7 clusters are identified according to similar dependency types justified by the peculiarities of the infrastructure around the target points. In existing buildings, pedestrian underpasses reduce the probability of accident, compared to surface crossings. Furthermore, the results show that the presence of tram stops near metro stations increases the probability of accident around the target point. When the exits of metro stations are away from the main avenues, a decrease in the probability of accident is observed. For future study, the scope of the developed methodology is recommended to be extended by incorporating additional urban infrastructure features, such as road geometry, traffic density, lighting conditions, and environmental factors to explore their influence on the causes and dynamics of road accident. By integrating these variables, future study would develop a more comprehensive understanding of how different infrastructure elements contribute to road safety outcomes. Therefore, the developed methodology would be used in the activities of relevant government agencies to address the issues of improving road safety.
This study was funded by the Russian Science Foundation (project No. 23-78-10176, https://rscf.ru/en/project/23-78-10176/).
Ahmed, S, Hossain, A, Ray, S, Bhuiyan, M & Sabuj, S 2023, 'A study on road accident prediction and contributing factors using explainable machine learning models: Analysis and performance', Transportation Research Interdisciplinary Perspectives, vol. 19, pp. 100814, https://doi.org/10.1016/j.trip.2023.100814
Azhar, A, Ariff, NM, Bakar, MAA & Roslan, A 2022, 'Classification of driver injury severity for accidents involving heavy vehicles with decision tree and random forest', Sustainability, vol. 14, no. 7, pp. 4101, https://doi.org/10.3390/su14074101
Behnood, A & Mannering, F 2017, 'The effect of passengers on driver-injury severities in single-vehicle crashes: A random parameters heterogeneity-in-means approach', Analytic Methods in Accident Research, vol. 14, pp. 41–53, http://dx.doi.org/10.1016/j.amar.2017.04.001
Bhuiyan, H, Ara, J, Hasib, KM, Sourav, MIH., Karim, FB, Sik-Lanyi, C, Governatori, G, Rakotonirainy, A & Yasmin, S 2022, 'Crash severity analysis and risk factors identification based on an alternate data source: A case study of developing country', Scientific Reports, vol. 12,article 21243, https://doi.org/10.1038/s41598-022-25361-5
Billah, K, Sharif, HO & Dessouky, S 2021, 'Analysis of pedestrian–motor vehicle crashes in San Antonio, Texas', Sustainability, vol. 13, no. 12, article 6610, https://doi.org/10.3390/su13126610
Chand, A, Jayesh, S & Bhasi, AB 2021, 'Road traffic accidents: An overview of data sources, analysis techniques and contributing factors', Materials Today: Proceedings, vol. 47, pp. 5135–5141, https://doi.org/10.1016/j.matpr.2021.05.415
Chen, H, Zhao, Y & Ma, X 2020, 'Critical factors analysis of severe traffic accidents based on Bayesian network in China', Journal of Advanced Transportation, vol. 4, pp. 1–14, https://doi.org/10.1155/2020/8878265
Chen, T, Zhang, CH & Xu, L 2016, 'Factor analysis of fatal road traffic crashes with massive casualties in China', Advances in Mechanical Engineering, vol. 8, pp. 1–11, https://doi.org/10.1177/1687814016642712
Ciprian-Sorin, V, Mircea, I, Ivascu, L & Rosca, E 2024, 'Approaching road infrastructure vulnerability from a mobility management perspective: A 5 year analysis of accident dynamics in Brasov county', Annals of the Academy of Romanian Scientists Series on Engineering Sciences, vol. 16, no. 2, pp. 98–108, https://doi.org/10.56082/annalsarscieng.2024.2.98
Dushkin, RV 2021, 'Multi-agent systems for cooperative ITS', Trends and Management, vol. 1, pp. 42–50, https://doi.org/10.7256/2454-0730.2021.1.34169
Geremew, G 2024, 'Analyzing road traffic accidents through identification and prioritization of accident-prone areas on the Dembecha to Injibara highway segment in Amhara region, Ethiopia', Scientific Reports, vol. 14, no. 1, article 24276, https://doi.org/10.1038/s41598-024-74483-5
Gianfranchi, E, Spoto, A & Tagliabue, M 2017, 'Risk profiles in novice road users: Relation between moped riding simulator performance, on-road aberrant behaviors, and dangerous driving', Transportation Research Part F: Traffic Psychology and Behaviour, vol. 49, pp. 132-144, https://doi.org/10.1016/j.trf.2017.06.016
Gutman, S., Vorontsova, P., Seredin, V. 2021, Evaluation of Readiness of the Urban Environment to the Introduction of the Concept of “Smart Transport” in the Subjects of the Russian Federation, , International Journal of Technology, vol. 12, no. 7, pp. 1369-1378, https://doi.org/10.14716/ijtech.v12i7.5340
Hee, L, Khamis, N, Noor, R, Karim, S & Puspitasari, P 2024, 'Predicting fatality in road traffic accidents: A review on techniques and influential factors', in Karim, SA (ed), Intelligent Systems Modeling and Simulation III, Studies in Systems, Decision and Control, vol. 553, pp. 343-367, https://doi.org/10.1007/978-3-031-67317-7_21
Islam, M & Mannering, F 2021, 'The role of gender and temporal instability in driver-injury severities in crashes caused by speeds too fast for conditions', Accident Analysis and Prevention, vol. 153, article 106039, https://doi.org/10.1016/j.aap.2021.106039
Jittawiriyanukoon, C, Srisarkun, V, 2018, An Approximation Method of Regression Analysis in Concurrent Big Data Stream, International Journal of Technology, vol. 9, no. 1, pp. 192-200, https://doi.org/10.14716/ijtech.v9i1.1509
Lazarev, YG, Talipova, LV & Cherkashin, AV 2022, 'Methodology for creating a TSODD database based on PostgreSQL and IndorTrafficPIan', Travel Navigator, vol. 52, no. 78, pp. 26-33
Lyu, N, Cao, Y, Wu, C, Xu, J & Xie, L 2018, 'The effect of gender, occupation and experience on behavior while driving on a freeway deceleration lane based on field operational test data', Accident Analysis and Prevention, vol. 121, pp. 82–93, https://doi.org/10.1016/j.aap.2018.07.034,
Madushani, S, Sandamal, K, Meddage, DPP, Pasindu, HR & Gomes, P 2023, 'Evaluating expressway traffic crash severity by using logistic regression and explainable, supervised machine learning classifiers', Transportation Engineering, vol. 13, article 100190, https://doi.org/10.1016/j.treng.2023.100190
Malin, F, Norros, I & Innamaa, S 2019, 'Accident risk of road and weather conditions on different road types', Accident Analysis and Prevention, vol. 122, pp. 181-188, https://doi.org/10.1016/j.aap.2018.10.014
Onieva-García, MA, Martínez-Ruiz, V & Lardelli-Claret, P 2016, 'Gender and age differences in components of traffic-related pedestrian death rates: Exposure, risk of crash and fatality rate', Injury Epidemiology, vol. 3, article 20, https://doi.org/10.1186/s40621-016-0085-4
Orsini, F, Gecchele, G, Gastaldi, M & Rossi, R 2019, 'Collision prediction in roundabouts: A comparative study of Extreme Value Theory approaches', Transportmetrica A: Transport Science, vol. 15, no. 2, pp. 556-572, https://doi.org/10.1080/23249935.2018.1515271
Pang, J, Krathaus, A, Benedyk, I, Ahmed, SS, & Anastasopoulos, PC 2022, 'A temporal instability analysis of environmental factors affecting accident occurrences during snow events: The random parameters hazard-based duration model with means and variances heterogeneity', Analytic Methods in Accident Research, vol. 34, article 100215, https://doi.org/10.1016/j.amar.2022.100215
Papadimitriou, E & Theofilatos, A 2017, 'Meta-analysis of crash-risk factors in freeway entrance and exit areas', Journal of Transportation Engineering Part A Systems, vol. 143, no. 10, article 04017050, https://doi.org/10.1061/JTEPBS.0000082
Park, S, Jang, K, Park, SH, Kim, DK & Chon, KS 2012, 'Analysis of injury severity in traffic crashes: A case study of Korean expressways', KSCE Journal of Civil Engineering, vol. 16, pp. 1280-1288, https://doi.org/10.1007/s12205-012-1527-3
Rifat, M, Asif, K, Kabir, A & Huq, A 2024, 'An explainable machine learning approach to traffic accident fatality prediction', In: 28th International Conference on Knowledge-Based and Intelligent Information and Engineering Systems (KES 2024), vol. 246, pp. 1905-1914, https://doi.org/10.48550/arXiv.2409.11929
Rodionova, M, Skhvediani, A & Kudryavtseva, T 2021, 'Determinants of pedestrian–vehicle crash severity: Case of Saint Petersburg, Russia', International Journal of Technology, vol. 12, no. 7, pp. 1427-1436, https://doi.org/10.14716/ijtech.v12i7.5403
Rodionova, M, Skhvediani, A & Kudryavtseva, T 2022, 'Prediction of crash severity as a way of road safety improvement: The case of Saint Petersburg, Russia', Sustainability, vol. 14, no. 16, article 9840, https://doi.org/10.3390/su14169840
Sa'd, AHY, Saad, HHY & Abd Wahab, AA 2021, 'Maximal minimum Hamming distance codes for embedding SI in a data based BSLM scheme for PAPR reduction in OFDM', International Journal of Technology, vol. 12, no. 2, pp. 412–421, https://doi.org/10.14716/ijtech.v12i2.4350
Sakib, N, Paul, T, Anwari, N & Hadiuzzaman, M 2024, 'Ensemble-based model to investigate factors influencing road crash fatality for imbalanced data', Transportation Engineering, vol. 18, article 100284, https://doi.org/10.1016/j.treng.2024.100284
Talipova, L, Morozova, E, Pestova, D & Skhvediani, A 2023, 'Methodology for creating a geographic information system for transport infrastructure facilities', International Journal of Technology, vol. 14, no. 8, pp. 1831-1840, https://doi.org/10.14716/ijtech.v14i8.6849
Wang, K, Ivan, JN, Ravishanker, N & Jackson, E 2017, 'Multivariate Poisson lognormal modeling of crashes by type and severity on rural two-lane highways', Accident Analysis and Prevention, vol. 99, pp. 6-19, https://doi.org/10.1016/j.aap.2016.11.006
Wang, Y, Xu, J, Liu, X, Zheng, Z, Zhang, H & Wang, C 2022, 'Analysis on risk characteristics of traffic accidents in small-spacing expressway interchange', International Journal of Environmental Research and Public Health, vol. 19, no. 16, article 9938, https://doi.org/10.3390/ijerph19169938
Yevtyukov, SA, Kurakina, EV & Yevtyukov, SS 2020, 'Statistical analysis and audit of expert road safety practices', Public Safety in the Field of Traffic: Professional Training and Organizational and Legal Tools, pp. 103-110
Yevtyukov, SS & Golov, EV 2017, 'Audit of traffic safety on highways of regional importance in the Leningrad region', Transport of the Urals, vol. 2, no. 53, pp. 85-89, https://doi.org/10.20291/1815-9400-2017-2-85-89
Zeng, Q, Wen, H, Huang, H, Pei, X & Wong, S 2017, 'A multivariate random-parameters Tobit model for analyzing highway crash rates by injury severity', Accident Analysis and Prevention, vol. 99, pp. 184-191, https://doi.org/10.1016/j.aap.2016.11.018
Zhou, B, Zhang, X, Zhang, S, Li, Z & Liu, X 2019, 'Analysis of factors affecting real-time ridesharing vehicle crash severity', Sustainability, vol. 11, no. 12, article 3334, https://doi.org/10.3390/su11123334
Ziakopoulos, A & Yannis, G 2020, 'A review of spatial approaches in road safety', Accident Analysis and Prevention, vol. 135, article 105323, https://doi.org/10.1016/j.aap.2019.105323