Chi-Square Oversampling to Improve Dropout Prediction Performance in Massive Open Online Courses
Corresponding email: insap@ugm.ac.id
Published at : 17 Jul 2025
Volume : IJtech
Vol 16, No 4 (2025)
DOI : https://doi.org/10.14716/ijtech.v16i4.7047
Liliana, Santosa, PI, Hartanto, R & Kusumawardani, SS 2025, ’ Chi-square oversampling to improve dropout prediction performance in massive open online courses’, International Journal of Technology, vol. 16, no. 4, pp. 1220-1231
| Liliana | 1. Department of Electrical and Information Engineering, Universitas Gadjah Mada; Bulaksumur, Caturtunggal, Depok, Sleman Regency, Special Region of Yogyakarta 55281, Indonesia. 2. Information System |
| Paulus Insap Santosa | Department of Electrical and Information Engineering, Universitas Gadjah Mada; Bulaksumur, Caturtunggal, Depok, Sleman Regency, Special Region of Yogyakarta 55281, Indonesia |
| Rudy Hartanto | Department of Electrical and Information Engineering, Universitas Gadjah Mada; Bulaksumur, Caturtunggal, Depok, Sleman Regency, Special Region of Yogyakarta 55281, Indonesia |
| Sri Suning Kusumawardani | Department of Electrical and Information Engineering, Universitas Gadjah Mada; Bulaksumur, Caturtunggal, Depok, Sleman Regency, Special Region of Yogyakarta 55281, Indonesia |

Massive Open Online Courses (MOOCs) are important to achieve educational quality in Indonesia. However, low retention rates are global problems that must be addressed by building a prediction model to prevent dropout. The prediction model faces a challenge due to the disproportionate comparison between major and minor data. In this study, the 141 datasets collected from the questionnaire consisted of 95% participant data who completed the course and 5% dropout data. This necessitated oversampling to balance the data using Synthetic Minority Over-sampling Technique for Nominal (SMOTE-N) and SMOTE for Encoded Nominal and Continuous (SMOTE-ENC) chi-square methods. The dataset formed was processed using Support Vector Machine (SVM) machine learning method. In the testing process, the performance of the prediction model with SMOTE-N and SMOTE-ENC chi-square oversampling data was compared with the prediction model with regular oversampling data. The results showed a significant increase in accuracy from each oversampling method with weighting. SMOTE-N weighting modification using chi-square value had the best value, with F1-measure reaching 95.33%, and a decrease in error in the prediction of dropout data was observed. This result showed that the model formed with the SMOTE-N chi-square method has good predictive ability.
Chi-square, Dropout Prediction, Indonesia, MOOC, Oversampling
Massive Open Online Courses (MOOCs) are independent online learning (Cidral et al., 2020), where students can select the desired materials. The concept of openness in MOOCs allows individuals to have the same opportunity to learn, regardless of location, and not be compelled to the flow of the curriculum. Currently, MOOCs have been widely used in the world, and the certificates have good legality.
Since 2014, various MOOCs have been utilized in Indonesia, including those sourced from abroad, licensed from foreign providers, or developed domestically. Considering Indonesian archipelagic geography and the resultant disparities in infrastructure and economic conditions, MOOCs offer a potential solution for promoting equitable access to education across the country (Safitri et al., 2025; Sutarman et al., 2024). Unfortunately, the user level is still at a low level, namely 0.4% of the population. The problems faced by MOOCs are the same, namely low retention rates, reaching 5-10% (Bozkurt and Akbulut, 2019), which is inversely proportional to high dropout rates. Various studies have been conducted to increase this retention such as determining factors in MOOCs use (Joo et al., 2018), building better designs (Haugsbakken, 2020), providing interesting delivery (Ahmad, 2021), or predicting dropout early (Abu Zohair, 2019).
Studies related to predicting dropout in MOOCs still have a good trend. This is because dropouts can be identified early with a good prediction method. By identifying dropouts early, the system can take action to retain course participants until course completion. A search on Google Scholar using a filter for 2020-2024 found 8290 publications with the keyword "MOOCs dropout prediction". This number increased by 60% from searches carried out with the same keywords, with the 2015-2019 filter. However, there are not many similar publications that are filtered with the additional keyword Indonesia. Some of the publications that appear do not show study locations specifically in Indonesia. Most were conducted in developed countries, where MOOCs have been used and supported by various supporting infrastructures (Deng et al., 2019). In developing countries, such as Indonesia, the use of MOOCs is still less popular (Lambert, 2020; Van De Oudeweetering and Agirdag, 2018) due to the basic needs that have not been met properly, including infrastructure conditions and resource ownership (Dillah et al., 2023; Alhazzani, 2020), financial conditions (Arhin and Wang’Eri, 2018), the use of foreign languages (Ruipérez-Valiente et al., 2020), and the ability to master technology (Hong et al., 2021).
Machine learning is widely used in predicting and forecasting outcomes, enabling more accurate decision-making and insights. In a literature study conducted by Dalipi (Dalipi et al., 2018), the three most frequently used machine learning methods are Logistic Regression, Support Vector Machine (SVM), and Decision Tree. SVM machine learning method was developed by Vladimir Vapnik (Schölkopf, 2003) and was known to possess good accuracy for small datasets (Abu Zohair, 2019), can be used in studies with many parameters (Nurhayati et al., 2015), and also valid for various fields (Cervantes et al., 2020). This method is a supervised machine learning algorithm that classifies data into two groups by creating vectors (hyperplanes).
Goopio (Goopio and Cheung, 2021) examined the factors that influence the dropout phenomenon in MOOCs and developed strategies to increase retention. Understanding the MOOCs dropout phenomenon and increasing knowledge about factors influencing retention enable MOOCs providers to improve the design features and course quality of MOOCs. In this study, publications were grouped related to retention in MOOCs, such as studies on predictions, sustainability of use, and level of motivation. The prediction process was grouped based on previous MOOCs usage, user activity on ongoing courses, and demographic data on course participants.
The problem that many people face in studies related MOOCs is the imbalance in the amount of data between those who completed the course and the dropouts. This imbalance can cause prediction accuracy on minor data to be less than optimal (Gyoten et al., 2020). In some conditions, minor data has a considerable influence on the prediction process, including in the process of predicting course completion (Fahrudin et al., 2019). Several methods were used by studies to overcome this problem, such as adjusting the training (Pazzani et al., 1994), or modifying the data (Japkowicz, 2000). Modification can be carried out by oversampling minor data to ensure equality with the major data. Another method is to reduce the amount of major data to match the minor (Japkowicz, 2000).
A method that is widely used to overcome data imbalance is synthetic data oversampling (Limanto et al., 2024) (Gyoten et al., 2020). Previous studies developed several oversampling methods, including Synthetic Minority Over-sampling Technique (SMOTE) (Fahrudin et al., 2016). However, SMOTE was developed for oversampling quantitative data. Several modifications that can be used for oversampling qualitative data are SMOTE for Nominal (SMOTE-N), SMOTE for Encoded Nominal and Continuous (SMOTE-ENC), and SMOTE for Nominal Continuous (SMOTE-NC) (Limanto et al., 2024). The difference between these three methods is that SMOTE-N can be used for qualitative data only, while SMOTE-ENC handles a mixture of qualitative and qualitative data. Meanwhile, SMOTE-NC can be used for the mixture, but cannot be used for qualitative data.
Previous studies suggested that oversampling by weighting underpopulated data was effective in improving the performance of the machine learning model (Limanto et al., 2024; Fahrudin et al., 2019). Tora developed AWH-SMOTE method (Fahrudin et al., 2019) which could be used to carry out oversampling on quantitative data. The Information Gain used in AWH-SMOTE method improved the performance of the prediction model when compared with other weighting methods. Meanwhile, Limanto et al built the GLoW SMOTE-D model (Limanto et al., 2024) for oversampling qualitative data. The trial results show that this method can improve the performance of predicting student failure in taking subjects when compared with other techniques.
In this study, approximately 5% of participants have not completed MOOCs. This is because the majority of participants took MOOCs due to work obligations, causing difficulty in measuring motivation factors. To handle this imbalance in the comparison of major and minor data, there is a need to carry out an oversampling process. Therefore, this study aimed to improve the ability of MOOCs participant dropout prediction model by modifying the weighting of SMOTE-N and SMOTE-ENC oversampling methods. Weighting was carried out using chi-square method which measured the correlation between indicators and output in qualitative data. The primary dataset was obtained by distributing questionnaires to participants who had used MOOCs as a learning tool. The collected data was processed using Structural Equation Modeling (SEM) method (Mustakim et al., 2023) and the blindfolding process showed that the predictive relevance value had a moderate indication. Based on this result, the data was processed using machine learning to obtain predictions for dropout from MOOCs. Data processed using SVM was eliminated according to the factors accepted in the model formed. The trial was carried out by comparing the prediction from chi-square SMOTE with the dataset prediction results from oversampling using SMOTE-N and SMOTE-ENC. Prediction results were measured using accuracy levels, including recall, precision, and F1-measure.
The presentation in this article is divided into three parts. The first part explains the methodology carried out, followed by a presentation of the results. The final section presents conclusions and outlines possibilities for future exploration.
This study was carried out in stages, as shown in Figure 1. First, an instrument was prepared based on a previous study, and the primary data was collected by distributing questionnaires to various participants who met the requirements. Planning is carried out to build a prediction model because data processing using SEM shows predictive capabilities. At the preprocessing stage, the data composition was balanced, by developing SMOTE-N and SMOTE-ENC chi-square oversampling methods. The dataset and oversampling results were processed using SVM machine learning method, and model performance was measured. Details of the study methodology are described in the following section.
2.1. Dataset Collection
The study instrument was prepared based on previous results (Liliana et al., 2022). The result showed that the factors influencing retention in MOOCs in developing countries are resources (Sánchez-Prieto et al., 2016), social influence (Cancino-Gómez et al., 2025; Dewberry and Jackson, 2018), self-efficacy (Briz-Ponce et al., 2017), perceived ease of use (Taghizadeh et al., 2021), and perceived usefulness (Reparaz et al., 2020). The first five factors were based on results from a literature of 89 Scopus studies sorted by location (Liliana et al., 2022). These factors were found to influence MOOCs retention in developing countries. Meanwhile, the power distance and Uncertainty Avoidance factors were used on the basis that Indonesia as the study location was a country with high scores on the power distance and uncertainty avoidance indicators (Hofstede Insights, 2022). This result showed that Indonesians had a tendency to be controlled by people who are more powerful, such as parents, teachers, or seniors in the office, and prefer to avoid conflict by obeying the superior.

Figure 1 Study Methodology for Data Processing and Model Evaluation
Survey questions were prepared with educational study psychologists, in the form of a combination of closed-ended questions (closed-ended questionnaires) using the Likert scale method (Awang et al., 2016). Data collection was carried out through questionnaires and collected 141 MOOCs users in Indonesia. The demographic profile shows a digital learner population, with an age distribution of 17-25 years (37%), 26-40 53.5%, and >40 (9.4%). A total of 88.2% of participants took MOOCs in the last 1 year. Distribution of questionnaires was carried out through social media, such as Facebook and Instagram, as well as WhatsApp, and email media. A challenge encountered during data collection was the relatively low awareness and recognition of MOOCs among the target audience, with many participants unfamiliar with the concept and platforms such as Coursera.
Most of the participants were from Java Island and those from outside only made up 8% due to the gap in the quality of infrastructure. The infrastructure referred to here is the smooth running of the internet network and the existence of supporting hardware. Several studies found that the quality of this infrastructure, in addition to influencing productivity in the economic sector (Sukwika, 2018), was also closely related to the quality of public education (Sinta and Wahyuni, 2022). Moreover, locations that are harder to reach typically have lower-quality internet, contributing to lower internet literacy among the local population. The majority of participants were able to complete MOOCs because providing the course was a work obligation. Several participants who were not obligated to learn through work reported having no prior experience with MOOCs, citing alternative learning sources (YouTube or blogs) as sufficient. This causes an imbalance in the amount of data on MOOCs participants who passed and those who did not complete the course.
A total of 141 data were collected in this study, and 5% were participants who had used MOOCs but did not successfully complete the course. There is an imbalance in the amount of data between participants who can complete the course and those who dropped out in the learning process. Data collected from the questionnaire was processed using SEM model and SMART-PLS application (Puspasari et al., 2023). Based on the test results, social influence, self-efficacy, and perceived ease of use factors have a direct influence on behavioral intention. Meanwhile, perceived usefulness was found to have no positive influence on behavioral intention. This fact is consistent with a previous report (Issa and Isaias, 2016) that the perceived ease of use is more important than the perceived benefits captured by an individual.
2.2. Oversampling
Data oversampling was carried out by developing SMOTE-N and SMOTE-ENC chi-square methods. In terms of performance comparison, oversampling was also carried out using SMOTE-N and SMOTE-ENC methods. In general, SMOTE functions by searching for the closest minor data points and creating new data based on similarities. In SMOTE-N, the determination of data duplication was calculated using Value Difference Metric (VDM) distance formula, as shown in Equation (1) (Chawla et al., 2002). VDM equation was used to calculate the value difference matrix for each nominal feature in a certain set of feature vectors (algorithm 1). Meanwhile, the determination of data duplication in SMOTE-ENC was calculated using the Euclidean Distance formula, as shown in Equation (2) (Gyoten, Ohkubo and Nagata, 2020).

where
x = value of field a of record r1
Y = value of field a of record r2
(x, y) = the distance between x and y
K = a constant that usually has a value of one or two
Cx = the number of occurrences of the value x in field/column a (c1)
Cy = the number of occurrences of the y value in field/column a (c2)
i = 0, 1 --> 0 passes, 1 dropout
Cx,I = the number of occurrences of the value x in field/column a which has an output column/field = i
Algorithm 1 How SMOTE works
1. Identify minor data
2. Randomly select 1 minor data point
3. Select K-nearest neighbors (k=3) from the minor data group using the VDM formula
4. Select 1 nearest neighbor data
5. Repeat steps 1–4 until the amount of data is balanced

where
M = the number of fields/features/columns other than the output
X = first record
Y = second record
E(x, y) = the distance between x and y
Development was carried out by weighting when calculating distance. The weights were obtained based on the results of correlation calculations with chi-square, as shown in Equation (3). Chi-Square is useful for testing the relationship between indicators and output from the study data (Turhan, 2020). In another study, weighting using chi-square method provided quality improvements in the bad data detection process (Gol and Abur, 2015).

where
X,Y = variables whose correlation will be calculated
Oij = frequency of observations
Eij = expected frequency
n = the number of possible values of variable X
m = the number of possible values of variable Y
Four types of oversampling were carried out, namely with values N=1000, 1300, 1500, and 2000, aimed at predicting with proportionally different data. The variable N was used to determine the number of duplicate data, where N value must be a multiple of 100. When N=1000, then the amount of minor data will be 11x the original. For example, the initial number of minor data is 7, with N=1000 duplication, the number of minor data will be 77.
2.3. Prediction
The prediction model was built using SVM method and the implementation was carried out in the Python programming language. To ensure the quality of the model, predictions were carried out using 10-fold cross-validation (Malakouti et al., 2023), where the dataset was grouped into 10 parts. One part was used for testing and the remaining was used for training.
2.4. Prediction Model Performance
The performance of the prediction model includes accuracy, recall, precision, and F1-measure, as seen in Equations 4 - 7 (Radha and Nelson Kennedy Babu, 2020). The confusion matrix (Chawla et al., 2002) is a table that shows the comparison between the actual value and the predicted value from the model (Table 1). In this case, the True Negative (TN) condition shows that the model can predict the value 0 correctly. The number 0 represents the condition of the participants who passed the course. Similarly, False Negative (FN) shows the model's prediction error regarding the actual value of 0. True Positive (TP) condition shows that the model is able to predict the value 1 correctly, where 1 represents the condition of participants who dropped out of the course. False Positive (FP) shows the model's prediction error regarding actual value 1.
Table 1 Confusion Matrix

The accuracy value shows the model's ability to make predictions on major and minor data, compared to the overall results. Recall measures how well the model can determine existing positive conditions (dropouts), compared to actual dropout data. Furthermore, precision measures how accurate the model is when making dropout predictions compared to dropout prediction data. F1-measure is the harmonic value of recall and precision, providing a balanced picture between the two matrices, to ensure that the model has a balanced ability to predict both major and minor data.
In the machine learning process, there were 30 parameters of the questionnaire, where passing and dropout were marked with an output of 0 and 1, respectively. The composition of major (pass) and minor (dropout) data was very different, namely 95% and 5%. Therefore, data oversampling was carried out using SMOTE-N and SMOTE-ENC chi-square methods. Meanwhile, for comparison, oversampling was carried out on the same dataset using the usual SMOTE-N and SMOTE-ENC methods.
Table 2 shows the processing of the oversampling dataset using SVM. The measurement results show that the initial dataset does not have the ability to predict minor data (dropout). This is evidenced by the average recall, precision, and F1-measure values of 0.0%, suggesting TP value = 0 (the model cannot predict dropout at all). Meanwhile, the oversampling dataset in F1-Measure column shows an increase in the prediction accuracy of minor data, and the level of accuracy increases as the comparison becomes more balanced.
Table 2 Level of Accuracy of Prediction Results
Figure 2 shows a comparison of F1-measure accuracy for each method. The error level in the prediction results is measured using Root Mean Square Error (RMSE) (Pande et al., 2023). A low RMSE value indicates that the regression results are close to the actual values (Dananjaya et al., 2022). Based on the calculation results, SMOTE-N oversampling method shows stable performance when N=1500 (minor data duplication reaches 16x the initial data amount). Meanwhile, other methods show increased performance in all accuracy calculations, even when minor data duplication reaches 21x the initial data amount.
F1-measure value in predictions using a weighted dataset was better than the value produced through SMOTE-N and SMOTE-ENC methods without weighting. Meanwhile, SMOTE-N and SMOTE-ENC chi-square did not have a significant difference. This result shows that SMOTE-N and SMOTE-ENC chi-square methods provide improved performance in the prediction model.
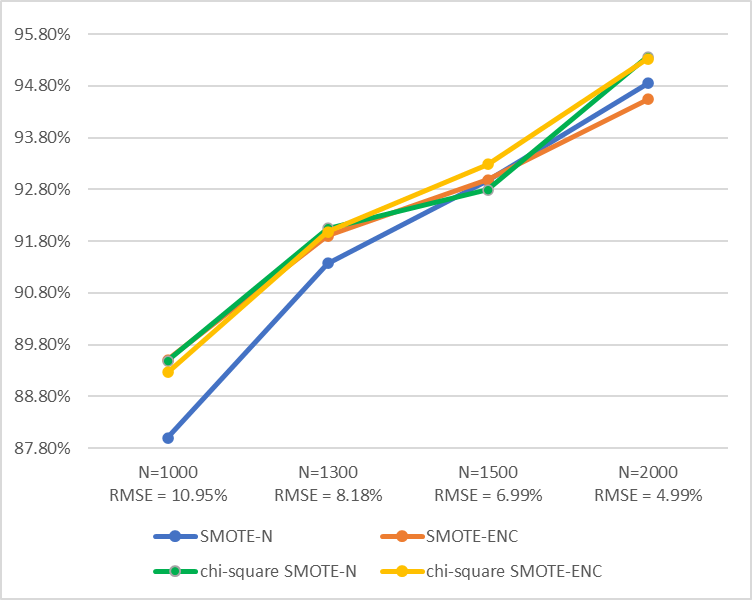
Figure 2 Comparison of F1-Measure from various oversampling datasets
The level of accuracy shows the model's performance in predicting major and minor data. Figure 3 shows a comparison of the accuracy values of the initial dataset with the modified results. The result of this study shows that the initial dataset has an accuracy level of 94.42%, but 0% in the recall value (TP=0), suggesting the model’s ability to predict only major data (graduation). The level of accuracy in the dataset resulting from oversampling using SMOTE and SMOTE-ENC methods is lower when compared to the initial dataset. However, there was an increase in the recall value and precision value. This result shows that the model with the oversampled dataset can predict minor data (dropout).
Based on the precision value (Figure 4) in the oversampling dataset, an increase in the N value shows an increase in the precision value. The precision value in the dataset resulting from oversampling using SMOTE-N chi-square method consistently shows a higher average for all N values than the other three methods. This result shows that the error in the dropout prediction (FP) decreases as the precision value increases (Equation 6). Therefore, SMOTE-N chi-square oversampling method produced a lower dropout prediction error.
In general, with N=2000, the best method in this trial was chi-square SMOTE-N (Table 3). Calculations were carried out by processing accuracy data at N=2000 with the Rank.Avg formula in Excel, as shown in Equation (8). From these calculations, the modification of SMOTE-N chi-square method has a significant impact on the dataset processed in SVM.
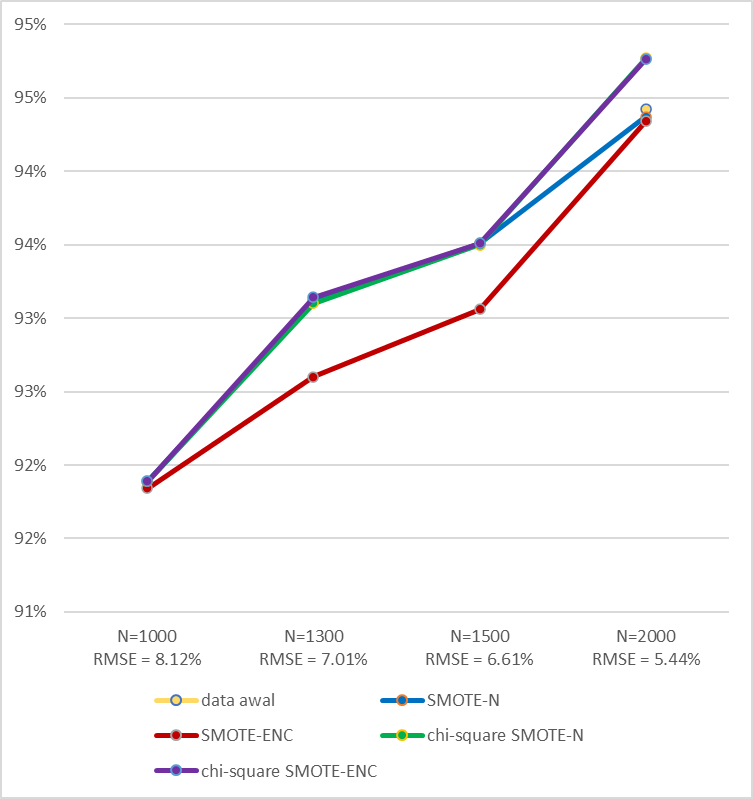
Figure 3 Accuracy comparison of various oversampling datasets
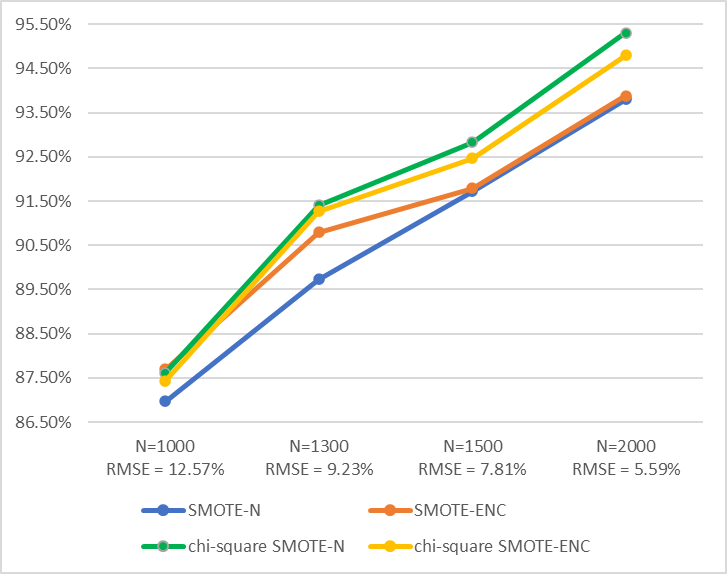
Figure 4 Precision comparison of various oversampling datasets
Table 3 Ranking Method with N=2000

where
R = ranking obtained for each accuracy
Nilai = performance in each cell
Range = performance on the measured column
Order = sorting method, 0 for descending
In conclusion, the condition of the initial dataset used in this study could not predict dropout data (minor data) because the proportion was unbalanced. Oversampling of the dataset was carried out using SMOTE-N and SMOTE-ENC chi-square. The two modified methods could increase prediction accuracy on minor data, compared to processing the oversampling dataset without weighting. This result was consistent with the report of previous studies where weighting carried out using SMOTE method provided better results for quantitative data. The weakness of SMOTE-N and SMOTE-ENC chi-square methods was the relatively longer processing time compared to SMOTE-N and SMOTE-ENC. Therefore, this method still held the potential for further development, enabling datasets to be processed more efficiently.
The authors gratefully acknowledge the financial support provided by Universitas Surabaya (UBAYA) through its scholarship program, which has made this research possible. We also extend our sincere appreciation to all individuals and institutions who contributed to the successful completion of this study
Abu Zohair, LM 2019, 'Prediction of student’s performance by modelling small dataset size', International Journal of Educational Technology in Higher Education, vol. 16, no. 1, article 27, https://doi.org/10.1186/s41239-019-0160-3
Ahmad, EA 2021, 'Content presentation techniques for learning experience enhancement in massive open online course (MOOC)', International Journal of E-Learning and Higher Education, vol. 14, no. 1, pp. 19-32, https://doi.org/10.24191/ijelhe.v14n1.1412
Alhazzani, N 2020, 'MOOC’s impact on higher education', Social Sciences & Humanities Open, vol. 2, no. 1, article 100030, https://doi.org/10.1016/j.ssaho.2020.100030
Arhin, V & Wang’Eri, T 2018, 'Orientation programs and student retention in distance learning: The case of University of Cape Coast', Journal of Educators Online, vol. 15, no. 1, https://doi.org/10.9743/JEO2018.15.1.6
Awang, Z, Afthanorhan, A & Mamat, M 2016, 'The Likert scale analysis using parametric based structural equation modeling (SEM)', Computational Methods in Social Sciences, vol. 4, no. 1, pp. 13-21, https://doi.org/10.5281/zenodo.1299429
Bozkurt, A, & Akbulut, Y 2019, 'Dropout patterns and cultural context in online networked learning spaces', Open Praxis: International Council for Open and Distance Education, vol. 11, no. 1, pp. 41-54, https://doi.org/10.5944/openpraxis.11.1.940
Briz-Ponce, L, Pereira, A, Carvalho, L, Juanes-Méndez, JA & García-Peñalvo, FJ 2017, 'Learning with mobile technologies – Students’ behavior', Computers in Human Behavior, vol. 72, pp. 612–620, https://doi.org/10.1016/j.chb.2016.05.027
Cancino-Gómez, YA, Torres-Duque, PM, Alfonso-Orjuela, LC, Barbosa-Guerrero, LM & Palacios-Rozo, JJ 2025, 'Predictive factors of purchase behaviors on Facebook', International Journal of Technology, vol. 16, no. 3, pp. 835-845, https://doi.org/10.14716/ijtech.v16i3.6432
Cervantes, J, Garcia-Lamont, F, Rodríguez-Mazahua, L & Lopez, A 2020, 'A comprehensive survey on support vector machine classification: Applications, challenges and trends', Neurocomputing, vol. 408, pp. 189-215, https://doi.org/10.1016/j.neucom.2019.10.118
Chawla, N, Bowyer, KW, Hall, LO & Kegelmeyer, WP 2002, 'SMOTE: Synthetic minority over-sampling technique', Journal of Artificial Intelligence Research, vol. 16, pp. 321-357, https://www.jair.org/index.php/jair/article/view/10302/24590
Cidral, W, Aparicio, M & Oliveira, T 2020, 'Students’ long-term orientation role in e-learning success: A Brazilian study', Heliyon, vol. 6, no. 12, article e05735, https://doi.org/10.1016/j.heliyon.2020.e05735
Dalipi, F, Imran, AS & Kastrati, Z 2018, 'MOOC dropout prediction using machine learning techniques: Review and research challenges', IEEE Global Engineering Education Conference (EDUCON), pp. 1007-1014, https://doi.org/10.1109/EDUCON.2018.8363340
Dananjaya, RH, Sutrisno, S & Wellianto, FA 2022 ‘Akurasi penggunaan metode support vector machine dalam prediksi penurunan pondasi tiang (Accuracy of using the support vector machine method in predicting pile foundation settlement)’, Matriks Teknik Sipil, vol. 10, no. 3, pp. 298-305, https://doi.org/10.20961/mateksi.v10i3.64519
Deng, R, Benckendorff, P & Gannaway, D 2019, 'Progress and new directions for teaching and learning in MOOCs', Computers and Education, vol. 129, pp. 48–60, https://doi.org/10.1016/j.compedu.2018.10.019
Dewberry, C & Jackson, DJR 2018, 'An application of the theory of planned behavior to student retention', Journal of Vocational Behavior, vol. 107, pp. 100-110, https://doi.org/10.1016/j.jvb.2018.03.005
Dillah, AU, Asbari, M & Faris, M 2023, 'Educations guidelines: Merajut sistem pendidikan di negara berkembang ('Educations guidelines: Knitting together education systems in developing countries)', Journal of Information Systems and Management (JISMA), vol. 2, no. 5, pp. 93-95, https://doi.org/10.4444/jisma.v2i5.676
Fahrudin, T, Buliali, JL & Fatichah, C 2016, 'RANDSHUFF: An algorithm to handle imbalance class for qualitative data', International Review on Computers and Software, vol. 11, no. 12, pp. 1093-1104, https://doi.org/10.15866/irecos.v11i12.10956
Fahrudin, T, Buliali, JL & Fatichah, C 2019, 'Enhancing the performance of SMOTE algorithm by using attribute weighting scheme and new selective sampling method for imbalanced data set', International Journal of Innovative Computing, Information and Control, vol. 15, no. 2, pp. 423-444, https://doi.org/10.24507/ijicic.15.02.423
Gol, M & Abur, A 2015, 'A modified chi-squares test for improved bad data detection', 2015 IEEE Eindhoven PowerTech, vol. 1, pp. 1–5, https://doi.org/10.1109/PTC.2015.7232283
Goopio, J & Cheung, C 2021, 'The MOOC dropout phenomenon and retention strategies', Journal of Teaching in Travel and Tourism, vol. 21, no. 2, pp. 177-197, https://doi.org/10.1080/15313220.2020.1809050
Gyoten, D, Ohkubo, M & Nagata, Y 2020, 'Imbalanced data classification procedure based on SMOTE', Total Quality Science, vol. 5, no. 2, pp. 64-71, https://doi.org/10.17929/tqs.5.64
Haugsbakken, H 2020, 'Five learning design principles to create active learning for engaging with research in a MOOC', European Journal of Open, Distance and E-Learning, vol. 23, no. 1, pp. 32-45, https://doi.org/10.2478/eurodl-2020-0003
Hofstede Insights 2022, 'What about Indonesia?', Hofstede Insights, viewed 29 July 2022 (https://www.hofstede-insights.com/country/indonesia)
Hong, JC, Hsiao, H-S, Chen, P-H, Lu, C-C, Tai, K-H & Tsai, C-R 2021, 'Critical attitude and ability associated with students’ self-confidence and attitude toward “predict-observe-explain” online science inquiry learning', Computers and Education, vol. 166, article 104172, https://doi.org/10.1016/j.compedu.2021.104172
Issa, T & Isaias, P 2016, 'Internet factors influencing generations Y and Z in Australia and Portugal: A practical study', Information Processing and Management, vol. 52, no. 4, pp. 592–617, https://doi.org/10.1016/j.ipm.2015.12.006
Japkowicz, N 2000, 'Learning from imbalanced data sets: A comparison of various strategies', AAAI Workshop on Learning from Imbalanced Data Sets, pp. 10–15
Joo, YJ, So, H-J & Kim, NH 2018, 'Examination of relationships among students’ self-determination, technology acceptance, satisfaction, and continuance intention to use K-MOOCs', Computers and Education, vol. 122, pp. 260-272, https://doi.org/10.1016/j.compedu.2018.01.003
Lambert, SR 2020, 'Do MOOCs contribute to student equity and social inclusion? A systematic review 2014–18', Computers and Education, vol. 145, article 103693, https://doi.org/10.1016/j.compedu.2019.103693
Liliana, L, Santosa, PI & Kusumawardani, SS 2022, 'Completion factor in massive open online course in developing countries: A literature review in 2015–2021', World Journal on Educational Technology: Current Issues, vol. 14, no. 2, pp. 456-472, https://doi.org/10.18844/wjet.v14i2.6919
Limanto, S, Buliali, JL & Saikhu, A 2024, 'GLoW SMOTE-D: Oversampling technique to improve prediction model performance of students failure in courses', IEEE Access, vol. 12, pp. 8889-8901, https://doi.org/10.1109/ACCESS.2024.3351569
Malakouti, SM, Menhaj, MB & Suratgar, AA 2023, 'The usage of 10-fold cross-validation and grid search to enhance ML methods performance in solar farm power generation prediction', Cleaner Engineering and Technology, vol. 15, article 100664, https://doi.org/10.1016/j.clet.2023.100664
Mustakim, F, Aziz, AA, Mahmud, A, Jamian, S, Hamzah, NAA & Aziz, NHBA 2023, 'Structural equation modeling of right-turn motorists at unsignalized intersections: Road safety perspectives', International Journal of Technology, vol. 14, no. 6, pp. 1216-1227, https://doi.org/10.14716/ijtech.v14i6.6644
Nurhayati, S, Luthfi, ET & Papua, UY 2015, 'Prediksi mahasiswa drop out menggunakan metode support vector (Predicting student drop out using the support vector method)', Prediksi Menggunakan SVM, vol. 3, no. 6, pp. 82-93
Pande, CB, Kushwaha, NL, Orimoloye, IR, Kumar, R, Abdo, HG, Tolche, AD, & Elbeltagi, A 2023, ‘Comparative Assessment of Improved SVM Method under Different Kernel Functions for Predicting Multi-scale Drought Index’, Water Resources Management, vol. 37, no. 3, pp. 1367–1399, https://doi.org/10.1007/s11269-023-03440-0
Pazzani, M, Merz, C, Murphy, P, Ali, K, Hume, T & Brunk, C 1994, 'Reducing misclassification costs', In: Proceedings of the 11th International Conference on Machine Learning, ICML 1994, pp. 217-225, https://doi.org/10.1016/B978-1-55860-335-6.50034-9
Puspasari, MA, Madani, ST, Iqbal, BM, Muslim, E, Sanjaya, BP, Pribadyo, CYP, Junistya, KN, Ghanny, A, Syaifullah, DH & Arista, SA 2023, 'Effect of distraction and driving behaviour to traffic accidents in Jakarta using partial least squares structural equation modeling (PLS-SEM)', International Journal of Technology, vol. 14, no. 7, pp. 1548-1559, https://doi.org/10.14716/ijtech.v14i7.6676
Radha, S & Nelson Kennedy Babu, C 2020, 'Enterprise big data analysis using SVM classifier and lexicon dictionary', International Journal of Enterprise Network Management, vol. 11, no. 1, pp. 65-75, https://doi.org/10.1504/IJENM.2020.103913
Reparaz, C, Aznárez-Sanado, M & Mendoza, G 2020, 'Self-regulation of learning and MOOC retention', Computers in Human Behavior, vol. 111, article 106423, https://doi.org/10.1016/j.chb.2020.106423
Ruipérez-Valiente, JA, Halawa, S, Slama, R & Reich, J 2020, 'Using multi-platform learning analytics to compare regional and global MOOC learning in the Arab world', Computers and Education, vol. 146, article 103776, https://doi.org/10.1016/j.compedu.2019.103776
Safitri, N, Huseini, M & Kusumastuti, R 2025, 'Proself or prosocial? The Indonesian academics motive to commercializing university research', International Journal of Technology, vol. 16, no. 3, pp. 1030-1041, https://doi.org/10.14716/ijtech.v16i3.6104
Sánchez-Prieto, JC, Olmos-Migueláñez, S & García-Peñalvo, FJ 2016, 'Informal tools in formal contexts: Development of a model to assess the acceptance of mobile technologies among teachers', Computers in Human Behavior, vol. 55, pp. 519–528, https://doi.org/10.1016/j.chb.2015.07.002
Schölkopf, B 2003, 'An introduction to support vector machines', Recent Advances and Trends in Nonparametric Statistics, vol. 2003, pp. 3-17, https://doi.org/10.1016/B978-044451378-6/50001-6
Sinta, T Della & Wahyuni, BD 2022, 'Kesenjangan sosial dalam mengakses pendidikan di Indonesia ('Social gap in access to education in Indonesia)', Edukasia Multikultura, vol. 4, pp. 11-28, https://doi.org/10.37216/tarbawi.v8i1.847
Sukwika, T 2018, 'Peran pembangunan infrastruktur terhadap ketimpangan ekonomi antarwilayah di Indonesia (The role of infrastructure development in economic inequality between regions in Indonesia)', Jurnal Wilayah dan Lingkungan, vol. 6, no. 2, pp. 115-130, http://dx.doi.org/10.14710/jwl.6.2.115-130
Sutarman, A, Kadim, A & Garad, A 2024, 'The effect of competence and organizational commitment on work productivity of Indonesian manufacturing industries', International Journal of Technology, vol. 15, no. 5, pp. 1449-1461, https://doi.org/10.14716/ijtech.v15i5.5775
Taghizadeh, SK, Rahman, SA, Nikbin, D, Alam, MMD, Alexa, L, Ling Suan, C & Taghizadeh, S 2021, 'Factors influencing students’ continuance usage intention with online learning during the pandemic: A cross-country analysis', Behaviour and Information Technology, vol. 41, no. 9, pp. 1998–2017, https://doi.org/10.1080/0144929X.2021.1912181
Turhan, NS 2020, 'Karl Pearsons chi-square tests', Educational Research and Reviews, vol. 15, no. 9, pp. 575-580, https://doi.org/10.5897/err2019.3817
Van De Oudeweetering, K & Agirdag, O 2018, 'MOOCs as accelerators of social mobility? A systematic review', Journal of Educational Technology & Society, vol. 21, no. 1, pp. 1-11, https://www.jstor.org/stable/26273863