Dynamic System Simulation to Improve the Effectiveness and Efficiency of Supply Chain Performance and Behaviour on Waste Bank Resik Becik
Corresponding email: ratihha@gmail.com
Published at : 31 Jan 2025
Volume : IJtech
Vol 16, No 1 (2025)
DOI : https://doi.org/10.14716/ijtech.v16i1.7365
Setyaningrum, R, Auralita, V, Izzhati, D, Arsiwi, P & Thalitha, T 2025, 'Dynamic system simulation to improve the effectiveness and efficiency of supply chain performance and behaviour on waste bank resik becik', International Journal of Technology, vol. 16, no. 1, pp. 136-145
| Ratih Setyaningrum | Industrial Department, Faculty of Engineering, Dian Nuswantoro University, Semarang 50131, Indonesia |
| Vida Auralita | Industrial Department, Faculty of Engineering, Dian Nuswantoro University, Semarang 50131, Indonesia |
| Dwi Izzhati | Industrial Department, Faculty of Engineering, Dian Nuswantoro University, Semarang 50131, Indonesia |
| Pramudi Arsiwi | Industrial Department, Faculty of Engineering, Dian Nuswantoro University, Semarang 50131, Indonesia |
| Tita Thalitha | Industrial Department, Faculty of Engineering, Dian Nuswantoro University, Semarang 50131, Indonesia |

Waste bank Resik Becik (BSRB) is one of the containers that help with waste management in the city of Semarang. Plastic waste that enters BSRB is collected, selected, and transformed into processed products with a sale value. Plastic waste that enters BSRB undergoes collection, selection, and transformation into processed products with saleable value. So, the flow of the supply chain process is one of the important elements of running the BSRB. Performance appraisal is the first step to improving the BSRB supply chain. The SCOR 11.0 (Supply Chain Operations Reference) method is a method of utilized for assessing supply chain performance. Various matrices are employed and customized to suit the company's specific conditions, enabling this method to represent the state of the company. The addition of this method is the AHP (Analytical Hierarchy Process) method as a determinant of the performance matrix weight and the normalization process. This allows the final value to be accurately determined. In this study, it was found that the supply chain conditions at BSRB were in good condition, with a value of 71.3438. The study of SCOR combined with dynamic systems can identify the five dimensions and interaction variables associated with the causal loop design model. SCOR models and dynamic systems provide more effective and efficient value by creating alternative scenarios. The first scenario is cutting indirect labour costs by $58,83. By adopting this alternative, BSRB reduces expenses from $580,25 to $639,07. Meanwhile, the second scenario involves scheduling waste collection from customers, which increases BSRB's expenditure to $681,35. The best scenario falls to the first scenario. The final result of this research is a simulation model in Powersim, or what is called a flow chart, that can show the entire supply chain system and its relevant systems.
AHP; Dynamic system; SCOR 11.0; Simulation; Supply chain
Until 2019, there were 220 Waste banks spread across Semarang City. One of them is Waste Bank Resik Becik (BSRB) which is located at Cokrokembang St. 11 Krobokan, West Semarang Subdistrict, Semarang, Central Java. BSRB is a consistent Waste bank from 2012 to 2021 in terms of waste management, especially plastic waste. BSRB is managed by Ika Yudha Kurniasari, who is assisted by three employees to make records to the archive book. BSRB also has several partners who help in the production process of plastic waste creations. The creations of plastic waste produced by BSRB are very diverse, such as key chains, tissue holders, laptop bags, school bags, drinking holders, wallets, woven prayer mats, mats, etc. The selling price range starts from $0,30 to $45,95.
Since its establishment, BSRB has continued to develop and improve, which is indicated by the increasing number of customers. One of the attractions of BSRB in increasing the number of customers is the exchange program waste turns into money or nine kinds of basic needs. This program is expected to be a solution for waste management in Semarang by increasing public awareness of the importance of saving the environment.
As of January 2021, there are 610 customers on BSRB, but only about 10% of its total customers are actively depositing waste. Currently, the customers of BSRB are not only from around Krobokan but also from the other villages, who deposit their waste to BSRB. On the other side, not only customers, an important element that forms the basis for the operation of waste banks is the supply chain process flow. The flow of material, information, and financial flows in the supply chain flow will be developed in this research.
BSRB doesn’t have a supply chain management mapping model that regulates waste management from upstream to downstream or from customers until processed products are sold yet. BSRB needs to have a supply chain mapping to identify areas that can be improved to achieve an expected system. Supply chain management has an output in the form of predictions from the condition of the system that can be used as a reference in determining the optimal cost-saving measures for BSRB. According to the trend, there is a tendency for the demand for waste collection from BSRB customers continue to increase. This raises the question of whether the shuttle system provided by the BSRB to encourage public enthusiasm will remain relevant to be implemented. Moreover, for waste transportation, BSRB disbursed funds of $2,45 for fuel costs and driver fees. Seeing this condition, mapping efforts using a simulation system are needed to provide a new perspective on supply chain management that requires a comprehensive solution because this issue is influenced by several factors. In addition, system simulation provides a real picture of the model built and is a substitute for the trial and error method as a decision-making policy. Based on those aforementioned backgrounds, it is found that there is urgency in the preparation of the BSRB supply chain management mapping model. Through this paper entitled "Dynamic System Simulation to Improve Effectiveness and Efficiency of Supply Chain Performance and Behaviour on Waste Bank Resik Becik", the researchers conducted a BSRB supply chain flow modeling which is expected to be more effective and efficient using a dynamic methodology system that utilizes Powersim Software.
Research Originality
In the previous research conducted by Estiningtyas et al. (2019), the topic focused on designing information system systems at Waste Bank Resik Becik. The current study builds upon and develops that research further. The dynamic system has been used for various supply chain problems (Nurhasanah and Utama, 2014; McGarvey and Hannon, 2004). Additionally, Budiawan and Syahrial (2018) conducted a study on supply chain management using SCOR methods.
The previous research related to supply chain management (SCM), such as, a study focused on SCM for the potato agroindustry (Irawati et al., 2022), volume of plastic waste optimization (Setyaningrum et al., 2022a), intelligence spatial for the potato agroindustry (Yusianto, 2019;2020a;2020b), SCM for catfish feed (Setyaningrum, 2020a), the design of supply chain for catfish feed (Budisetio et al., 2021), supply chain competitiveness (Arsiwi and Adi, 2020), the implementation information system for the waste bank (Rachmadanti et al., 2021), SCM for the oil palm agroindustry (Heryani et al., 2022), and the Analytic Hierarchy Process (AHP) used to evaluated Supplier (Hazza et al., 2022). Further, to produce effective supply chain management (Setyaningrum, 2024; 2023a), it is necessary to consider the success factor (Setyaningrum, 2020b; Panne et al., 2003) and Indonesian culture (Setyaningrum, 2016; Setyaningrum, 2022a; Hofstede, 2012). General supply chain effect on waste management (Hazza, 2022; Heryani, 2022; Xu, 2023).
Previous research related to waste management and supply chain management has been carried out by previous researchers. General concept waste management (Ganguly, 2024; Ordonkor, 2021; Amicarelli, 2021; Woon, 2021), assessment waste management (Kala, 2022 and Wang, 2023), optimization waste management (Wilson, 2015 and Abdallah, 2019). Waste management based on material waste (Susanto, 2024) and innovative ecosystem (Khoirunisa, 2023). Previous research related to implementation in small and medium industries to improve productivity (Setyaningrum, 2023b; Kusumo, 2021).
This study was conducted to improve the effectiveness and efficiency of the BSRB supply chain performance. The following research stages were carried out with several methods are as follows:
Data Collecting
The data collection
In this study consists of the observation of the production process and purposive interviews related to the BSRB supply chain management system, company documentation, files, archives, or company records, as well as a questionnaire for validation and weighting of KPIs (Key Performance Index) for the SCOR method. Firstly, the KPI questionnaire obtained that there were 40 KPIs, later, it was given to the BSRB (who felt they knew well the problems and conditions of the company) for any validation. By this, there were 23 valid KPIs validated. It was carried out to ensure whether the KPIs that have been identified were appropriate and feasible.
Data Processing
The stages of data processing are as follows:
Supply Chain Performance Measurement using the SCOR 11.0 (Supply Chain Operation Reference)
Hugos (2024) stated that the SCOR model was designed as a tool to describe, measure, and evaluate any supply chain configuration. Thus, companies must implement specific supply chain management practices based on their unique set of competitive priorities and business conditions to achieve the desired level of performance. After measuring supply chain mapping and data collection, supply chain performance is then measured as the required data to generate calculations for SCOR performance which will then be simulated through dynamic system simulation.
Dynamic System Simulation using Powersim Software
The simulation is based on the results of performance measurement using Powersim Software to provide a new perspective on supply chain management that requires a comprehensive solution. These changes are shown through simulation or real-time and constant calculation of components with alternative future actions (McGarvey and Hannon, 2004). In addition, system simulation can be a substitute for the trial and error method as a decision-making policy.
Research Sites
This research was carried out at BSRB. BSRB was engaged in the inorganic waste processing, especially plastic packaging for domestic waste. BSRB is located at Cokrokembang St. 11 Krobokan, West Semarang Subdistrict, Semarang, Central Java. There are four main data used in the study as follows:
Main Raw Material Supplier Data
It is the kind of data that the main raw material supplier. It consists of customer name, size of customer, region, supplier capacity, and duration time.
Supplier of Supporting Raw Material Data
This data focuses on supporting raw material, which consists of the kind of product, volume product, defect size, and cycle time of supporting raw material.
Manufacturer Data
This data relates to the producer’s data which consists of the kind of product success, production size, defective product, cycle time, direct cost, indirect cost, and total manpower.
Consumer Data
This data type is important to see consumer patterns etc. This study collects this data, which consists of demand, product price, delivery size, and cycle time.
SCOR 11.0
Identifying BSRB Supply Chain Scheme
Based on the supply chain concept, there are three streams to be a concern, such as the flow of materials, information, and finances occurring at Waste Bank Resik Becik. The flow of material flows in only one direction, from upstream to downstream. The process starts with the raw materials used, into finished products, until the processed products are sent to consumers. The flow of information and finance has a two-way flow, both from upstream to downstream and downstream to upstream.
Information flow in supply chain management is needed in industrial activities so that there is no misunderstanding between sides and integration between one side with another becomes more efficient. The financial flow includes the costs incurred, starting from the purchase of raw materials to suppliers, production costs, and shipping costs.
For the outflows that lead to collectors, they are supporting sides in the BSRB supply chain who are tasked with picking up waste that is not needed by the BSRB to produce creative processed products, for example, glass bottle waste, useless books, useless newspapers, useless cooking oil, electronic waste, etc.
SCOR Process Decomposition
SCOR includes three levels of processes, where the three levels indicate that SCOR performs process decomposition from the general to the detailed to obtain company KPIs whose performance will be measured. KPIs designed with the SCOR approach are based on the main supply chain perspective, such as plan, source, make, delivery, return, and enable. This KPI will be an indicator of the success of the company's supply chain performance. The following is a decomposition of the SCOR process from the business processes running in BSRB, as shown in Table 1.
Table 1 BSRB Business Process.
After identifying the business process, the next step is to identify KPI (Key Performance Indicator), which is verified by having a questionnaire to 1 respondent at BSRB. From each perspective obtained above, there are six dimensions, such as reliability, responsiveness, agility, cost, and asset management. From the five dimensions that are adjusted to the conditions and objectives of the company, it is obtained that KPIs are included in six perspectives, and in five dimensions, 23 valid KPIs are obtained.
Weighting and Normalization Calculation
After getting 23 KPIs, the next step is to weigh and normalize the Snorm de Boer Below is the weighting using the AHP (Analytical Hierarchy Process) method in the form of a questionnaire and brainstorming with the BSRB. The weighting is done from level 1 to level 3:
Level 1 is the weighting for each perspective, that is, between the perspectives of plan, source, make, deliver, return, and enable.
Level 2 is the weighting for each dimension from each supply chain perspective.
Level 3 is the weighting for each KPI from each dimension in each perspective.
After getting the local weight, the next step is to calculate the global weight. Global weight is the weight of a criterion against the goal of the hierarchy. The weighting calculation with AHP methods as shown in Table 2 (Data processing, 2024).
Based on the results of calculations for performance measurement using SCOR on all level 1 work indicators, the supply chain performance value of the Waste Bank Resik Becik in January 2020 was 71,43%, 70,38% in February 2020, and 72,21% in March 2020. So, the average is 71,34%. The calculation is obtained from the sum of the performance values on the Reliability, Responsiveness, Agility, Cost, and Asset Management matrix in each perspective. The supply chain performance is included in the Good category according to the performance indicator monitoring system, as shown in Table 3 (Waters, 2013).
Table 2 Weighting Calculation with AHP Method
Table 3 Performance Indicator Monitoring System.
Dynamic System Simulation
Before starting the dynamic system simulation, a Causal Loop Diagram (CLD) was designed to illustrate the cause-effect relationship of each entity that affects it.
Next, make a flow diagram as the main concept by using a mathematical formulation. Flowcharts are made with Powersim Software.
Model Simulation
By using Powersim, the simulation model that has been made is run to find out the results.
Validity Test
The process of model validity involves by checking whether the created model accurately represents the real conditions or not. While, data validation is conducted by calibrating the initial simulation results with the historical data owned.
Average comparison: E = S- AA
Description:
S = Average Value of the Simulation Result
A = Average Value of the Data
The model is considered valid if E ? 5%
Table 4 System Validity Test.
Alternative Scenario 1 as shown in Figure 1
Based on Figure 1, it shows that it cut indirect labor costs by $58,82 reducing it from $639,07 to $580,25. The decrease in expenditure came from two sources: $36,74 from indirect labor costs related to driver expenses and an additional $22,06 from driver gasoline costs. Cutting costs indirectly results in the elimination of the waste collection system from customers by three-wheeled motorbikes. By this, customers are required to come directly to the Waste Bank Resik Becik to deposit. The waste bank won’t be short of waste raw materials because the number of customers is increasing every year. Until 2021, the number of customers has reached 610 people. Alternative Scenario 2 is shown in Figure 2.
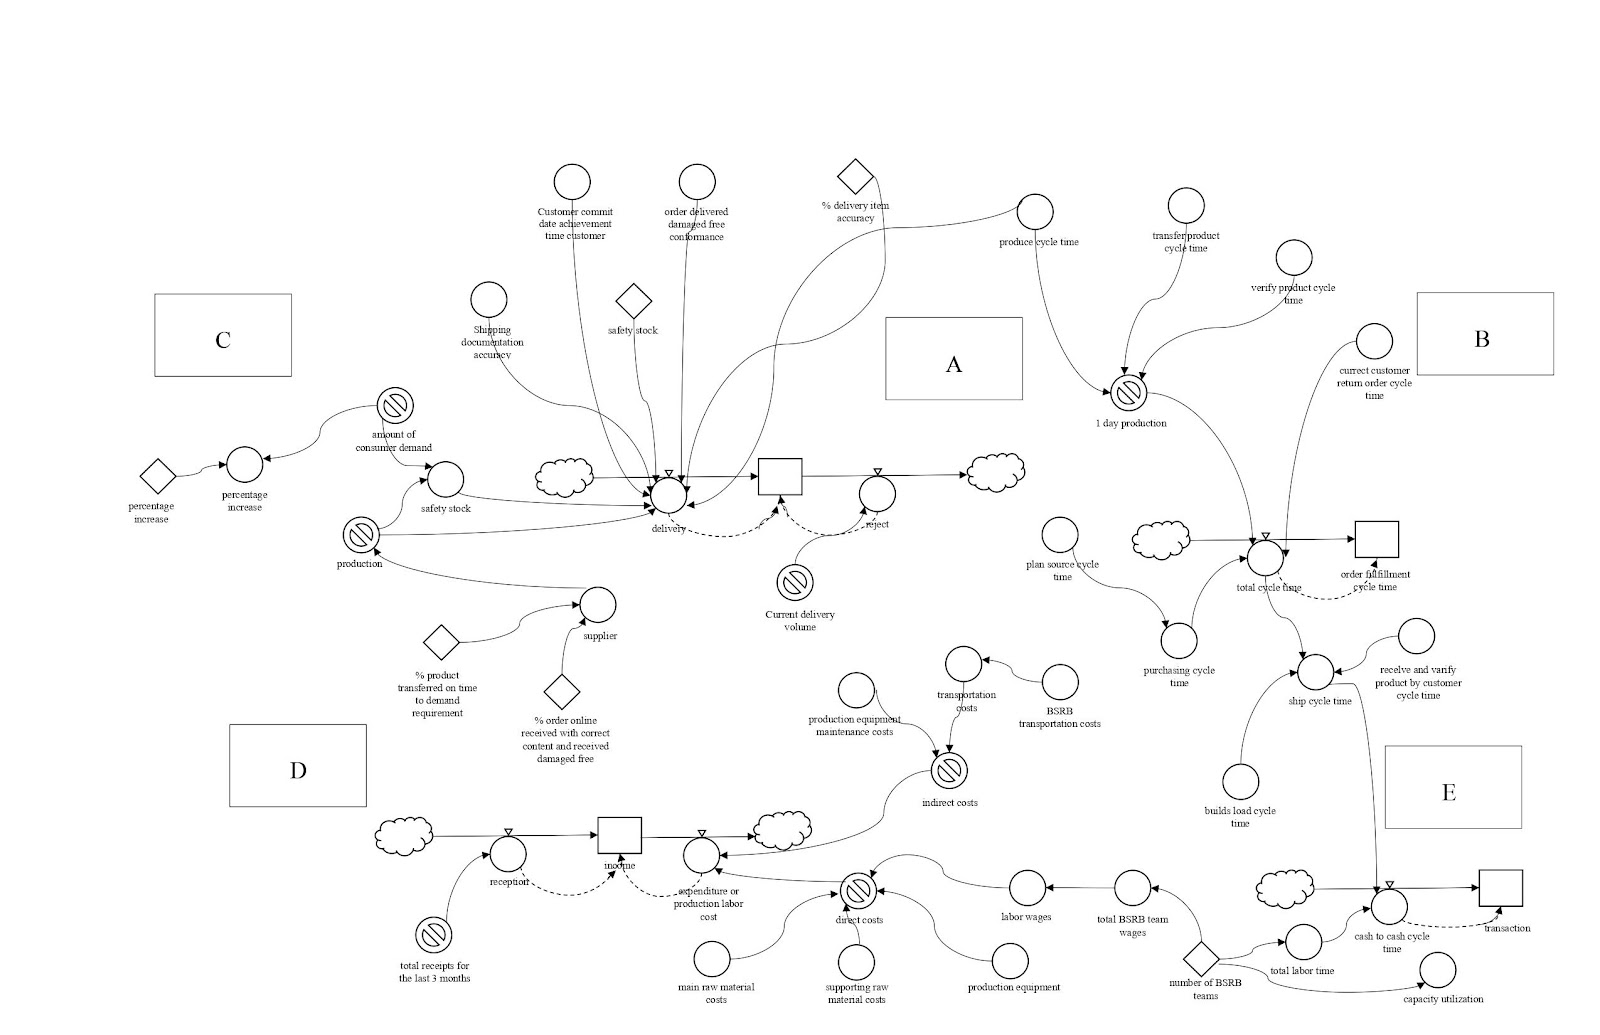
Figure 1 Alternative Scenario 1
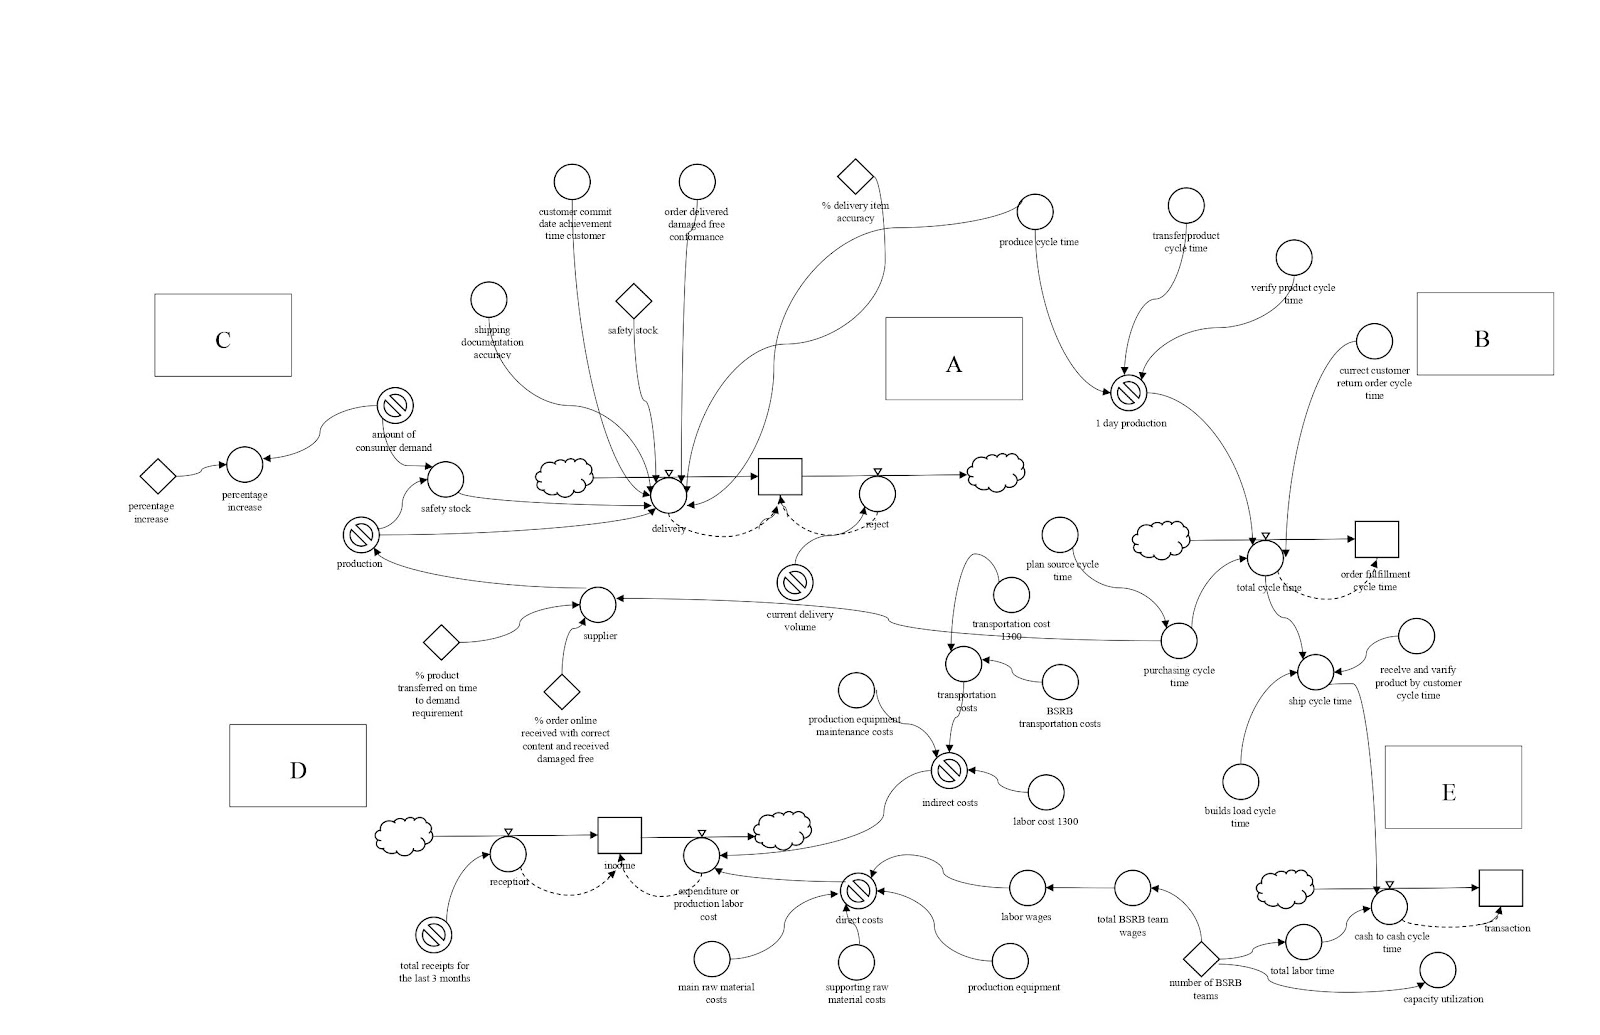
Figure 2 Alternative Scenario 2
From Figure 2, it can be seen that the scheduling of garbage collection two times a month using an L300 vehicle causes an increase in expenditure of $42,30 from the initial model. By using the L300 BSRB, the vehicle rental fee is $73,53, transportation costs are $18,38 and indirect labor fees are $9,19. While the initial model only incurs labor costs of $36,74 and transportation costs of three-wheeled motorcycles of $22,05. The comparison between the Initial Model and the Scenarios can be seen on Table 5.
Table 5 Comparison Between the Initial Model and the Scenarios.
It can be seen from Scenario 1 that the total expenditure of BSRB has decreased, while Scenario 2 showed the opposite result. From these comparisons, it can be concluded that Scenario 1 is the best scenario for this study.
The basic system of the plastic waste supply chain at Waste Bank Resik Becik consists of three main entities and one supporting entity. The main entities are suppliers, BSRB, and consumers, while the supporting entity are collectors. There are three flows, that are material, information, and finance flow. Meanwhile, the results of supply chain performance measurement using the Supply Chain Operation Reference (SCOR) method show that the process at Waste Bank Resik Becik consists of 6 perspectives, including Plan, Source, Make, Deliver, Return, and Enable, with 23 KPIs. The supply chain value in January is 71.44%, February is 70.38%, and March is 72.21%. It can be concluded that the average of the measurement results is in the good category, with a value of 71.34%.
The best scenario in the BSRB supply chain model is scenario 1, i.e., cutting indirect labor costs, that is, the costs incurred for three-wheeled motorbike drivers for three months amounting to $36,76. The cost-cutting affects the transportation costs used by the driver, which is $22,06 in 3 months. So, by cutting indirect labor costs, Waste Bank Resik Becik saves expenses of $5,88 or 9.2% in 3 months. Meanwhile, for scenario 2, the BSRB spent $681,35, or an increase of 6.6% from the current model. So scenario 1 is chosen as the best scenario.
Despite all the results, this study has limitations in supply chain performance and behaviour at Semarang and thus needs a further advanced study in the future.
Author Contributions
Software, V.A and R.S; Validation, V.A and T.T; Data collection and accuracy, R.A. and V.A.; Writing—Original draft, P.A andD.I; Funding acquisition, I.D.P. All authors have read and agreed to the published version of the manuscript.
Conflict of Interest
The author declare no conflict interest
| Filename | Description |
|---|---|
| R1-IE-6443-20230519104420.pdf | sertificate proofread |
Abdallah, M., Adghim, M., Maraqa, M., and Aldahab, E, 2019, ‘Simulation and optimization of dynamic waste collection routes’. Waste Management and Research, 37(8), pp. 793–802. https://doi.org/10.1177/0734242x19833152
Amicarelli, V., Lagioia, G., and Bux, C, 2021, ‘Global warming potential of food waste through the life cycle assessment: An analytical review’. In Environmental Impact Assessment Review, 91, 106677, Elsevier Inc. https://doi.org/10.1016/j.eiar.2021.106677
Arsiwi, P & Adi, PW 2020, ‘Interpretive structural modeling to improve the competitiveness at mina indo sejahtera sme’s supply chain’, Jurnal PASTI, vol. 14, no. 1, pp. 26-36, DOI: http://dx.doi.org/10.22441/pasti.2020.v14i1.003
Budiawan, A & Syahrial, R, 2018, ‘Supply chain performance measure using supply chain operation references (SCOR) approach in pacitan farmer group’, Jurnal Ilmu-Ilmu Pertanian AGRIKA, vol. 12, no. 2, pp. 154-163, https://doi.org/10.31328/ja.v12i2.766
Budisetio, SS, Setyaningrum, R, Arsiwi, P, Santoso, DA & Sawitri, DR 2021, ‘Supply chain network design of organic waste into catfish feed : case study at nusantara recycling center semarang’, Jurnal Ilmiah Teknik Industri dan Informasi, vol. 8, no. 2, pp.34-44, https://doi.org/10.31001/tekinfo.v8i2.800
Estiningtyas, RA, Jazuli & Talitha, T 2019, ‘Analysis and design of business process system at resik becik waste bank based on information technology to reduce service processing time’, Thesis, Dian Nuswantoro University.
Ganguly, R. M., Chaktaborty, S. K., 2024, ‘Plastic Waste Management during post Covid 19 pandemic : Chalenges and Strategies toeard Circular Economi’, Heliyon, 10. https://doi.org/10.1016/j.heliyon.2024.e25613
Hazza, MH, Abdelwahed, A, Ali, MY & Sidek, ABA 2022, ‘An integrated approach for supplier evaluation and selection using the delphi method and analytic hierarchy process (AHP): a new framework’ , International Journal of Technology, vol. 13, no. 1, pp. 16-25, https://doi.org/10.14716/ijtech.v13i1.4700
Heryani, H, Legowo, AC, Yanti, NR, Raharja, R, Mahfud, Djatna, T, Martini, S, Baidawi, T & Afrianto, I 2022, ‘Institutional development in the supply chain system of Iol palm agroindustry in south kalimantan’, International Journal of Technology, vol. 13, no. 3, pp. 643-654, https://doi.org/10.14716/ijtech.v13i3.4754
Hofstede 2013, The Hofstede Centre: Cultural Survey Report, Itim International, viewed 28 August 2013, (http://www.geert-hofstede.com)
Hugos, M 2024, Essentials of supply chain management, Fifth Edition, John Wiley and Sons, https://books.google.co.id/books?hl=en&lr=&id=zpz0EAAAQBAJ&oi=fnd&pg=PP7&dq=Hugos,+M.+(2002).+Essentials+of+Supply+Chain+Management.&ots=jAvICsH98j&sig=UlD7HRGg7XgM-Nc7-24m-t2liDs&redir_esc=y#v=onepage&q&f=false, online accessed : 12 Februari 2024.
Irawati, SD, Setyaningrum, R, Izzhati, DN & Yusianto, R 2022, ‘Identification of potato supply chain network design to increase farmer’s income’, In: 2022 The International Seminar on Application for Technology of Information and Communication, pp. 19-26, https://doi.org/10.1109/iSemantic55962.2022.9920372
Kala., Bolia, N. B., Sushil, 2022, ‘Analysis of Informal Waste management using System Dynamic Modelling’, Heliyon, 8. https://doi.org/10.1016/j.heliyon.2022.e09993
Khoirunisa, R., Musfiroh, A., and Gama, A, 2023, ‘The Identification of Challenges in Innovation Ecosystem of West Java Indonesia Using a Systematic Literatur Review’’, International Journal of Technology, vol. 14, no. 7, pp.1409-1418, https://doi.org/10.14716/ijtech.v14i7.662
Kusumo, P., Setyaningrum, R, Tjahyono, R, 2021, ‘Design an Ergonomic Crackers Dryer to Increase Production Productivity at Rahayu Krupuk SME’, ACM International Conference Proceeding Series, pp.31-34.
McGarvey, B & Hannon, B, 2004, Dynamic Modelling for Business Management, Springer-Verlag, New york Inc.
Nurhasanah, N & Utama, YT 2014, ‘System Dynamic Simulation to Predict The Success of Industrial Engineering Study Program Laboratory Development Strategy’, Journal Al-Azhar Indonesia Series Science and Technology 2, Ahmad Dahlan University
Ordonkor, ST & Sallar, AM, 2021, ‘Correlates of household Waste Management in Ghana: Implication for Public Health’, Heliyon, vol. 7, no. 11, article e08227 https://doi.org/10.1016/j.heliyon.2021.e08227
Panne, G, Beers, C & Kleinknecht, A 2003, ‘Success and failure of innovation: a literature review’, International of Innovation Management, vol. 7, no. 3, pp. 309-338, https://doi.org/10.1142/S1363919603000830
Rachmadanti, VA, Setyaningrum, R & Izzhati, DN, 2021, ‘PDCA analysis on management administration information based on android in resik becik semarang’, In: The 8th Annual Conference on Industrial and System Engineering (ACISE) and 1st International Conference on Ergonomic, Safety and Health (ICESH), Diponegoro University.
Setyaningrum, R, Aldo, D & Wijaya, D., 2022a, ‘Optimizing the volume of plastic bottle using mechanical press machine designed based on rational methods’, Advance Engineering Science Journal, vol. 54, no. 6, pp. 2247-2255 .
Setyaningrum, R, Santoso, DA, Tjahyono, R, Sawitri, DR & Arida, TA, 2020a, ‘Model and simulation organic waste supply chain flow into casfish’, Jurnal Ilmiah Teknik Industri dan Informasi, vol. 8, no. 2, https://doi.org/10.31001/tekinfo.v8i2.800
Setyaningrum, R, Subagyo & Wijaya, AR, 2020b, A mathematical model of factors driving product success in an indonesian market using design experiment, International Journal of Technology, vol. 11, no. 2, pp. 322-332, https://doi.org/10.14716/ijtech.v11i2.3428
Setyaningrum, R, Subagyo & Wijaya, AR, 2022a, ‘A mathematichal model of successful-product development by considering the indonesian culture’, International Journal of Technology, vol. 13, no. 3, pp.655-663, https://doi.org/10.14716/ijtech.v13i3.4751
Setyaningrum, R, Wijaya AR & Subagyo. 2016, ‘Meta-analysis of cultural correlation and product success’, Advanced Science Letters, vol. 22, no. 12, pp. 4155-4158, https://doi.org/10.1166/asl.2016.8086
Setyaningrum, R., Arsiwi, P., Talitha, T., Ramdhani, S., Jazuli., Suhailah, I., Sari, P. N., Nashir, M., 2023a, ‘A Supply Chain Flow Information System and Community Behaviour in Waste Management based on Industry 4.0’. The International Seminar on Application for Technology of Information and Communication IEEE, https://doi.org/10.1109/iSemantic59612.2023.10295294
Setyaningrum, R., Santoso, H.A., Rahman, M.S., Safsalta, B.F., Fajarudin, A.A., Majid, N., Andrian, F.F., Arsiwi, P., Talitha, T., Ramdhani, S., 2024h, ‘Organic Waste Management Information System Based on SCM And ERP’. The International Seminar on Application for Technology of Information and Communication IEEE, https://doi.org/10.1109/iSemantic63362.2024.10762384
Setyaningrum, R., Setiawan, N.W.A., Suprijono, H., Riskiyanto, M.J., 2023b, ‘Implementation Smart Technology Based on Indutry 4.0 Through The Redesign of The Solar Pond’, The International Seminar on Application for Technology of Information and Communication IEEE, https://doi.org/10.1109/iSemantic59612.2023.10295310
Susanto, D., Shahab, R.H., Alkadri, M.F., Brahim, S., 2024, ‘Evaluation of Reuse and Recycling Disaster Waste Materials for Post-disaster Shelter with Compressive Strength Testing and Case Study in Cianjur, Indonesia, International Journal of Technology, vol. 15, no. 6, pp.1771-1783, https://doi.org/10.14716/ijtech.v135i6.7328
Wang, Q., Duan, H., Miao, Q., Li, H., Liu, J., Wang, N., Xu, Q., 2023, ‘Environmental and economic impact assessment of synergistic organic-waste treatment strategies in eco-industrial parks: A pilot-scale case study in Shenzhen, China’, Environmental Impact Assessment Review, 103, 107250. https://doi.org/10.1016/j.eiar.2023.107250
Waters, D 2013, Supply Chain Management (An Introduction to Logistics), Red Globe Press.
Wilson, D. C., Rodic, L., Cowing, M. J., Velis, C. A., Whiteman, A. D., Scheinberg, A., Vilches, R., Masterson, D., Stretz, J., Oelz, B., 2015, ‘Waste aware benchmark indicators for integrated sustainable waste management in cities’. Waste Manage, 35, pp. 329–342. https://doi.org/10.1016/j.wasman.2014.10.006
Woon, K., S, Phuang., Z, X., Lin, Z., and Lee, C. T., 2021, ‘A novel food waste management framework combining optical sorting system and anaerobic digestion: A case study in Malaysia’. Energy, 232, 121094. https://doi.org/10.1016/j.energy.2021.121094
Xu, W., Luis, M., Yuce, B., 2023, ‘A Hybrid Method for The Closed-loop Supply Chain to Minimize Total Logistics Cost, International Journal of Technology, vol. 14, no. 7, pp.1449-1460, https://doi.org/10.14716/ijtech.v14i7.6710
Yusianto R., Marimin, Suprihatin, Hardjomidjojo, HH, 2020a, ‘Intelligent spatial decision support system concept in the potato agro-industry supply chain’, In: 2020 International Conference on Computer Science and Its Application in Agriculture (ICOSICA), IPB University, DOI: https://doi.org/10.1109/ICOSICA49951.2020.9243233
Yusianto, R, Marimin, Suprihatin & Hardjomidjojo, H 2019, ‘Intelligent spatial logistics DSS for tracking and tracing in horticultural food security’, In: The International Seminar on Application for Technology of Information and Communication, pp. 73-77, DOI: https://doi.org/10.1109/ISEMANTIC.2019.8884292
Yusianto, R., Marimin, Suprihatin, Hardjomidjojo, HH, 2020b, ‘Intelligent spatial decision support system concept in the potato agro-industry supply chain’, In: International Conference on Computer Science and Its Application in Agriculture (ICOSICA), IPB University, http://dx.doi.org/10.1109/ICOSICA49951.2020.9243233