Building Transparency through Halal and Quality Traceability System for Beef Distribution in Malang City, Indonesia
Corresponding email: ciptotip@ub.ac.id
Published at : 17 Jul 2025
Volume : IJtech
Vol 16, No 4 (2025)
DOI : https://doi.org/10.14716/ijtech.v16i4.5984
Sucipto, S, Syahputri, BE, Mulyarto, AR & Tolle, H 2025, ‘Building transparency through halal and quality traceability system for beef distribution in Malang City, Indonesia’, International Journal of Technology, vol. 16, no. 4, pp. 1253-1264
| Sucipto Sucipto | 1. Department of Agroindustrial Technology, Faculty of Agricultural Technology, Universitas Brawijaya, Veteran Street, Malang 65145, Indonesia. 2. Halal-Qualified Industry Development (Hal-Q ID), Fac |
| Bella Eka Syahputri | Department of Agroindustrial Technology, Faculty of Agricultural Technology, Universitas Brawijaya, Veteran Street, Malang 65145, Indonesia |
| Aunur Rofiq Mulyarto | Department of Agroindustrial Technology, Faculty of Agricultural Technology, Universitas Brawijaya, Veteran Street, Malang 65145, Indonesia |
| Herman Tolle | Faculty of Computer Science, Universitas Brawijaya, Veteran Street, Malang 65145, Indonesia |

Ensuring the availability of halal and quality beef is essential for the Indonesian population. To achieve this, developing a simple and reliable monitoring technology is necessary. Therefore, this study aimed to design a Radio Frequency Identification (RFID) traceability system to ensure the distribution of halal and quality beef. Halal beef data was recorded on RFID tag, while the quality beef was monitored in real-time through temperature, humidity, and the distribution vehicle's position. The design used in the study included LM35, DHT11 sensors, Global Positioning System (GPS) modules, and RFID tags. The accuracy, validity, and stability of the sensors were tested in three replications. The results showed that the average readings from the temperature and humidity sensors were accurate, valid, and stable with a deviation of ±3%. The simulation indicated that the product's information, including the sender's identity, destination, recipient, weight, type of cut, delivery time, receipt time, and halal status, could be recognized by different RFID tags and shown on the dashboard. Root Mean Square Error (RMSE) for monitoring beef distribution vehicle's position was 0.1290, showcasing accurate tracking using GPS module. RFID traceability system effectively and accurately monitored the distribution of integrated halal and quality beef in real-time.
Beef, GPS, Halal, RFID, Sensor, Traceability
Ensuring halal integrity of products is a process that covers various stages, including the provision of materials, processing, storage, packaging, distribution, sales, and serving. Integrating halal product guarantees is essential for food safety and quality, as consumers demand assurance that their products meet halal standards. To monitor the product supply chain effectively, traceability system is utilized, which comprises tracing, tracking, and maintaining product movement history (Bosona and Gebresenbet, 2013). This system enables the thorough oversight of supply chain activities, allowing for early detection to prevent unqualified products from reaching consumers (Millard et al., 2015). Transparent information is crucial for effective quality and halal traceability system in the supply chain. Additionally, the integration of traceability system is driven by consumers and the government concerns regarding health, safety, authenticity, and halal compliance (Mishra et al., 2015).
Traceability system, when integrated with the Internet of Things (IoT), uses a network of devices that communicate and interact to achieve common objectives (Sobral et al., 2018). The system serves as a tracking and communication tool, providing comprehensive information about a product, including the origin, processing, handling, and related activities throughout the supply chain (Haleem et al., 2019). Basic traceability consists of data identification, a database management system, and data exchange (Patidar et al., 2021). An example of traceability device used in the IoT-based halal food logistics system is Radio Frequency Identification (RFID). RFID is a contactless system that automatically identifies objects, animals, and people using radio waves (Alfian et al., 2020). Furthermore, it requires a reader and a tag attached to track the product (Sun, 2012). Several investigations on RFID-based traceability systems covered various sectors, including the kiwi fruit supply chain (Gautam et al., 2017), fresh vegetables supply chain (Mainetti et al., 2013), wheat flour storage (Qian et al., 2012), monitoring the quality of Italian cheese (Papetti et al., 2012), preventing contamination in agricultural food products (Farooq et al., 2016), wine production processes (Expósito et al., 2013), cold chain logistics (Trebar, 2015), recording farm and animal information on beef packages (Buskirk et al., 2013), and real-time tracking of agricultural food supplies during transportation (Bhutta and Ahmad, 2021).
Further review is needed on RFID traceability system with integrated halal and quality beef tracing. The system enables accurate and continuous real-time monitoring of objects (Syahputri, 2021). Therefore, this study uses RFID with halal practices to focus on the distribution process from the slaughterhouse to industrial consumers, providing transparent information on beef quality and halal status. The system monitors the vehicle's position, temperature, and humidity changes in real-time during distribution because beef is highly perishable. This real-time monitoring aims to prevent contamination and maintain beef quality. RFID tags are used to verify halal status of the product, providing detailed information such as the sender's identity, destination, recipient, weight, type of beef cut, delivery time, receipt time, and halal status. Moreover, the tags help in distinguishing between halal and non-halal beef.
In Indonesia, the use of tracking technology combining RFID with GPS for monitoring the quality and halal status of beef supply chain remains limited. The Ministry of Agriculture (2018) reported that Indonesian beef consumption in ASEAN was 48% per capita, equivalent to 2.6 kg. According to SNI 99003:2018 (BSN, 2018), halal products must be segregated from non-halal products during handling and transportation. Therefore, this study aims to develop a traceability system to facilitate monitoring of beef quality and contamination during distribution from the slaughterhouse to the processing industry or traditional markets.
This study began with a literature review covering traceability, halal food, supply chains, RFID, and Arduino technologies. Subsequently, quality and halal supply chain problems, particularly during distribution, were identified, and the variables impacting the quality and halalness were determined. According to Hadi (2019), various sensors, including temperature and humidity, have been developed alongside RFID system. The problem identification process was carried out through an interview with the slaughterhouse, with a focus on the distribution process. Currently, beef distribution from the slaughterhouse to consumers relied on a simple recording system, limited to basic location tracking. The unavailability of comprehensive records detailing sender information, destination, recipient, weight, type of beef cut, delivery time, receipt time, and halal status posed challenges for effective tracking and tracing during distribution. To address such issues, this study designed RFID traceability system with temperature, humidity, and GPS sensors. The system was developed using Arduino IDE computerized platform with the C/C++ programming language. After testing the system, validation was carried out to assess the accuracy of its design compared to the field data. Data was stored in a web server database and accessible through a laptop or smartphone. Documentation of monitoring activities was facilitated by exporting data through the adopted devices. The document served as a guide to address beef distribution challenges, and the study design was presented in Figure 1.
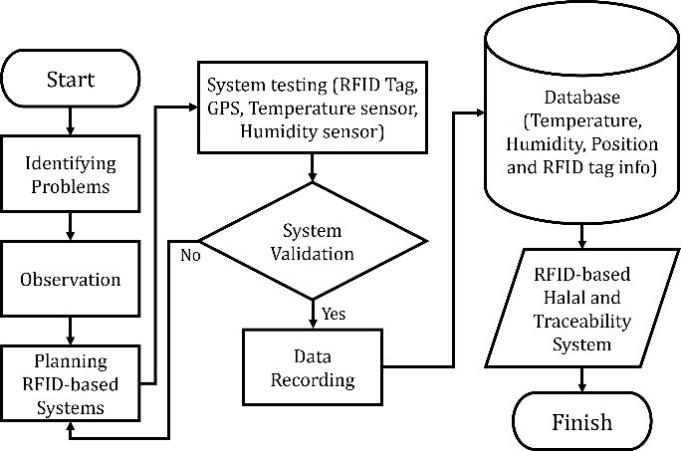
Figure 1 Study diagram of halal and quality by RFID design
2.1. Study Variable and Instrument
Traceability system of beef distribution aimed to maintain quality and halal standards. RFID facilitated product tracking during distribution, aiding in decisions regarding recalls due to decreased quality or mixing with non-halal products. The study variables were shown in Table 1, detailing the components of RFID-based traceability system. The system interfaced with a laptop using an Arduino UNO microcontroller. The inputs consisted of NodeMCU ESP8266, 11 RFID tags, RFID reader, LM35 Sensor, and DHT11 Sensor GPS Neo 6M Module, and the software used for RFID comprised Arduino IDE and Adafruit IO.
Table 1 Study variables of RFID-based traceability system distribution activities.
2.2. System Planning
The interview results showed that the slaughterhouse lacked a tracking system for product control during distribution. Therefore, integrating RFID-based traceability system would enable the slaughterhouse to monitor temperature, humidity, and vehicle location using GPS sensor and module during distribution. This sub-chapter described the design of system connections, sensors, and GPS modules.
2.2.1. System Connection Input Design
The programming script for traceability system was synchronized with Arduino IDE, Arduino UNO microcontroller, NodeMCU ESP8266, Arduino system store, and RFID to ensure data exchange and real-time dashboard presentation. The script, written in Arduino programming language, enabled connection to a modem or wireless local area network (WLAN) device for internet data network reception. NodeMCU ESP8266 served as the internet transmitter and receiver, registered on Arduino system. The system stored was considered an input for receiving data networks, connecting to the adafruit.io website as a Message Queuing Telemetry Transport (MQTT) broker. Data was automatically recorded in the system, with a sign-in display available on the broker website. Figure 2 provided the sign-in display on the adafruit.io website and the operational scheme of RFID system in this study.
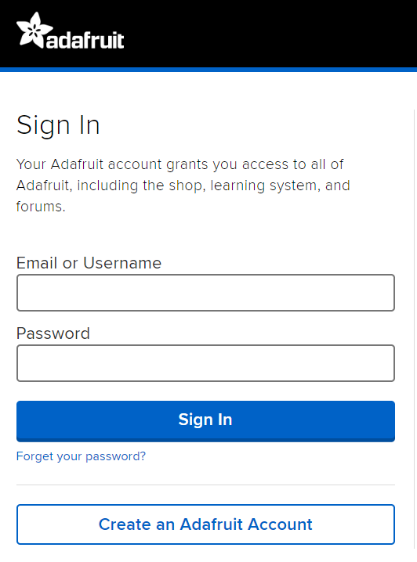
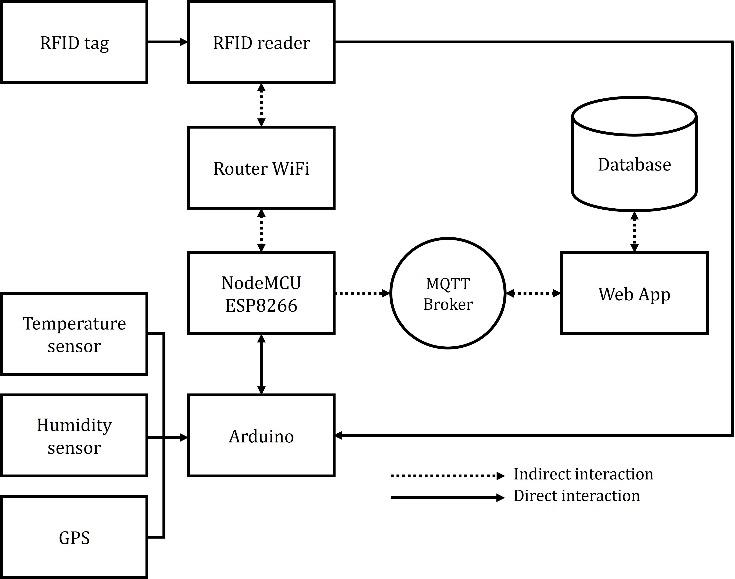
Figure 2 (a) Sign in to adafruit.io; (b) RFID system working scheme
2.2.2. RFID Reader and Tag Design
RFID reader, RFID-RC522, interacted with keychain tags to retrieve product information. Data collected by the reader was processed by NodeMCU ESP8266, connected to WLAN network. NodeMCU ESP8266 not only controlled the functions of connected components and read RFID tag information but also processed data from the module and presented it on the dashboard (Chin et al., 2022).
2.2.3. Sensor and GPS Component Design
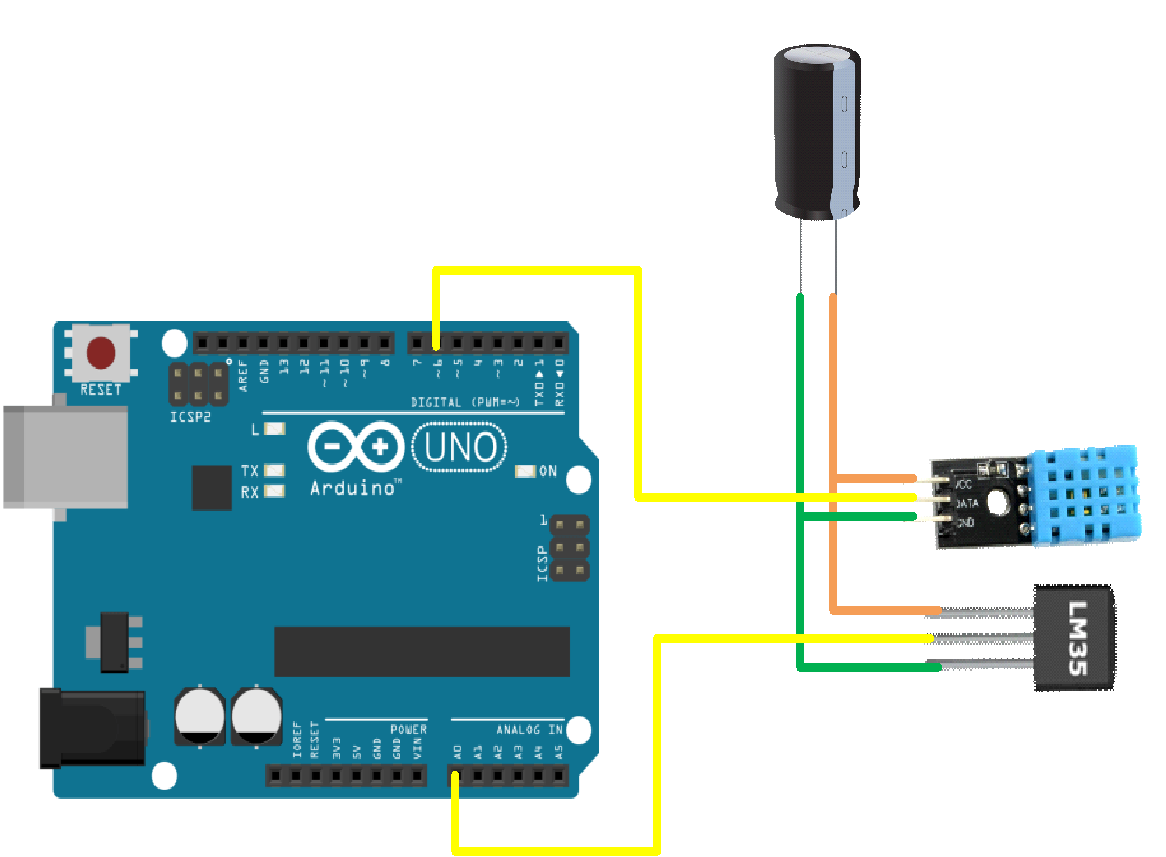
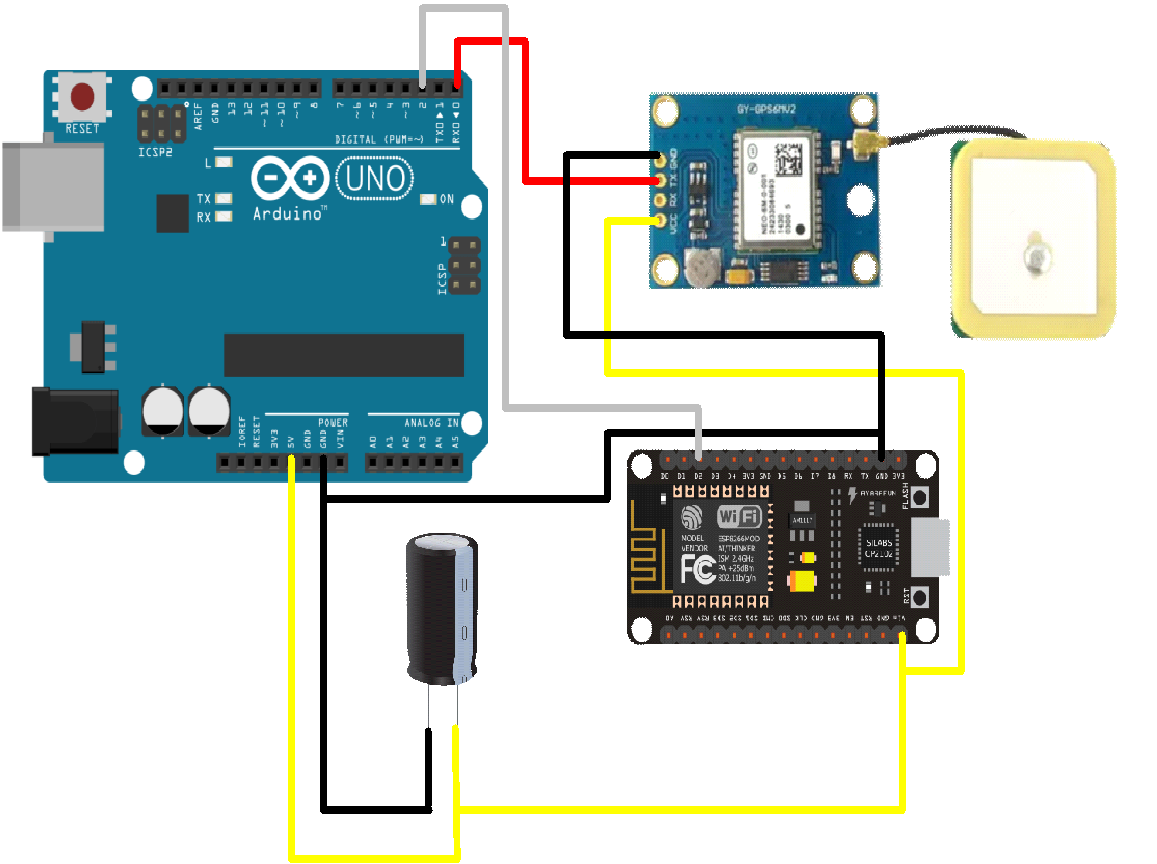
LM35 and DHT11 sensors, used for temperature and humidity readings, were connected to Arduino UNO board with wiring, as shown in Figure 3a. A capacitor was added to store electric current and filter voltage in this circuit. The capacitors, particularly electrolytic capacitors (ELCO), were then used when a large capacitance was required. ELCO were widely adopted due to their fixed value and polarity (poles + and -) (Gudavalli and Dhakal, 2018).
The Ublox Neo 6M GPS module, adopted to determine the vehicle position, was connected to Arduino UNO and ESP8266 boards with wiring (Figure 3b). GPS module received latitude and longitude data and presented it on a map. ESP8266 transferred position coordinate data through the internet network, stored it in a database, and presented it on the dashboard in 1 minute.
(b)
Figure 3 (a) LM35 and DHT11 Sensor Circuits on Arduino UNO; and (b) Ublox Neo 6M GPS Circuit on Arduino UNO
2.3. System Validation
The validation test measured the precision and accuracy of the system, and higher validity closer adherence to the standard. The position validation of the distribution vehicle adopted Root Mean Square Error (RMSE), while temperature and humidity validation used error percentage.
2.3.1. Position Validation (GPS)
The validation test of the distribution vehicle's position used RMSE, which calculated the geometric accuracy or degree of uncertainty of the object's position coordinates. RMSE measured the accuracy of digitized points compared to those in the field, representing the forecast error for a specific data set (Hendrarini et al., 2021; Rachmanto and Ihsan, 2020). RMSE calculation was shown in Equation 1.

Where Y is the actual value, Yi is the forecast value, and n is the amount of data.
RMSE calculation represented the distance traveled (location point) during beef distribution, tracked by GPS. The delivery time was recorded from the vehicle's departure point to its endpoint to calculate RMSE. RMSE facilitated a term-by-term comparison of estimated and measured values, indicating short-term model performance. According to Kambezidis (2012), smaller values corresponded to better performance. Fitriawan et al. (2020) suggested that RMSE of  0.33 indicated more accurate predictions than observations.
2.3.2. Temperature and Humidity Validation
Humidity validation was determined by calculating the error and percentage by comparing sensor readings with Thermohygrometer, serving as the test standard. Equation 2 computed the value and percentage error, as evidenced by the analysis of Isyanto et al. (2021).

where X is the actual value from the Thermo hygrometer and Xi is the measured value from the sensor reading.
When the error was above 7%, the sensor was declared unfit and required calibration. A large error adversely affected the prototype's accuracy and the response to sensor readings (Nasution and Harahap, 2020).
This section discussed the validation, testing results, and simulation of halal and quality system using RFID tags with the development implications. The data would be provided on the dashboard when the tag functioned correctly.
3.1. Temperature and Humidity Sensor Testing
Testing and validating LM35 and DHT11 sensors for temperature and humidity were carried out by comparing the recorded sensor readings data stored in the database against the standard. The standard temperature results were obtained from a digital thermo-hygrometer—sensor testing for 2 hours outdoors without treatment in a stationary condition for 3 days. Temperature changes were manually recorded every 15 minutes, and Table 2 presented the average error of DHT11 and LM35 sensors.
Table 2 Calculation of DHT11 and LM35 sensor average error
Based on Table 2, the largest average error of DHT11 sensor on the first day was 3%, and the smallest on the second day was 1%. The average error of LM35 sensor was the smallest on the second day at 1%. These results showed that DHT11 and LM35 sensors for temperature readings were valid and could be used. According to Nasution and Harahap (2020), an error above 7% rendered the sensor unfit and required calibration. Furthermore, the temperature and humidity readings of DHT11 and LM35 sensors were stable, as shown in Table 3. The average temperature did not significantly differ, with the largest difference being ±1oC, and the average humidity differed by ±3%. Temperature and humidity changes on the device were limited to readings on the web dashboard.
Table 3 Average sensor readings LM35 and DHT11
3.2. GPS Tracking and Validation
The position of beef distribution vehicle was tracked using Neo 6M GPS module, which connected to the internet network through a modem. Neo 6M GPS module received device coordinates when the indicator light blinked, detecting position by reading latitude and longitude (Kharisma et al., 2019). Location points were recorded in 1 minute, and beef delivery covered a distance of 2.37 km in 13 minutes. The final destination of beef shipment, tracked in real-time, was the Malang traditional market at 17.53 UTC (+7) or 00.53 WIB, with coordinates -8.023411, 112.630361. Figure 4 showed that Google Maps measured the distance from the vehicle’s departure point to beef distribution destination. The coordinate points recorded in the database were inputted on Google Maps, and the distance between points was measured using the distance menu. The point data (latitude, longitude) and the distance of beef distribution were shown in Table 4.
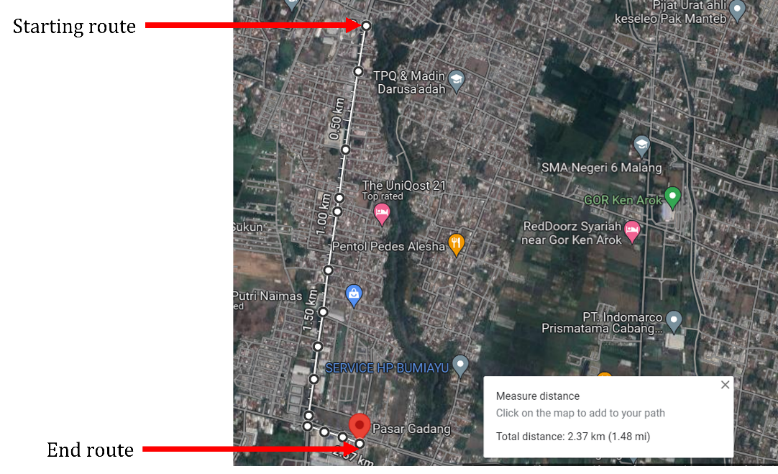
Figure 4 Distance measurement from the starting to the endpoint of beef delivery
RMSE was used for position validation and assessing geometric accuracy. It analyzed the error calculation of digitized points in the image compared to those in the field (Rachmanto and Ihsan, 2020; Wibisono and Setiawan, 2015). According to Fitriawan et al. (2020), RMSE of 0.33 indicated accurate prediction. RMSE of distance and time of delivery was detailed in Table 5, and Figure 5 showed a linear regression of distance to time.
Table 4 Data points and distances for beef distribution locations
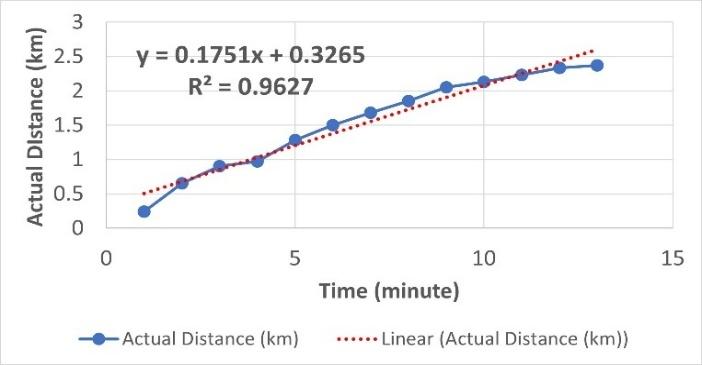
Figure 5 Graph of actual distance against delivery time
Coordinate accuracy was determined by residual measurement data in the field, comprising GPS measurements and satellite image coordinates. The residual value of the X and Y coordinates was used to calculate RMSE (Kurniawan et al., 2015). The X-coordinate represented the actual distance on Google Maps satellite imagery, while the Y-coordinate was a model forecast generated using linear regression from GPS measurement data. Linear regression assumed that changes in one variable were accompanied by changes in other variables (Bazdaric et al., 2021). The position validation from the initial coordinates to beef delivery point resulted in RMSE of 0.1290. RMSE of  0.33 indicated a model accurately provided the actual distance, and GPS module enabled real-time monitoring of beef shipments.
Table 5 RMSE of distance and delivery time
3.3. Simulation of Halal and Other Information with RFID Tag
RFID tag in this study covered all possible products, including carcass, non-carcass, and offal packaged. The keychain-shaped tag was selected for easy attachment to the packaging, with 10 tags containing product-related information, each featuring a unique code. However, the simulation used six tags, comprising two for halal products, two for products without halal certificate, and two for haram products.
The information on the tag included sender, destination, recipient, weight, type of beef cut, delivery time, receipt time, and halal status verified by the slaughterhouse. Product information inputted on the tag was simulation data. This simulation mixed products previously tagged with RFID tags containing halal, haram, and unclear product information to assess the system’s ability to distinguish between the information.
Tags 1 and 3 signified halal products (tag codes 83CCCC73 and D0121FC3), while Tags 6 and 10 represented products without halal certification (tag codes 5B671EC3 and 82E420C3). Tags 5 and 7 signified haram products (tag codes 549948D3 and 755146D3). The tag was attached to the product in carcass distribution room and registered with the reader. When scanned and entered into the system, the tag code appeared on ID dashboard, and its information was shown on RFID dashboard, as provided in Figure 6.
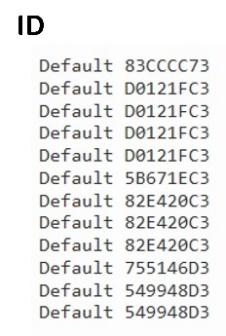
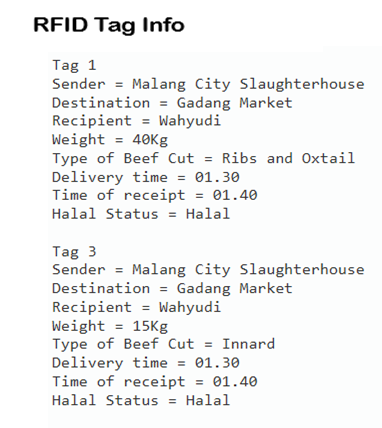
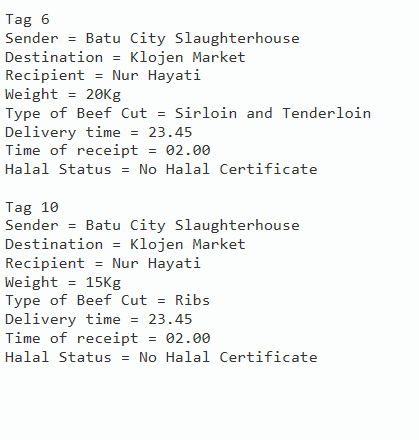
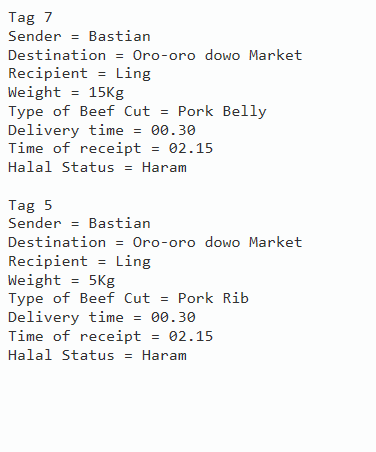
Figure 6 System simulation: (a) RFID tag code and (b) RFID tag info.
The system effectively read and identified product information tags, showcasing them on the dashboard. This capability ensured the system could detect contamination when halal, haram, or unclear products were transported together in the vehicle, indicating the importance of halal traceability in beef distribution.
3.4. Beef Delivery Temperature and Humidity Record
Table 6 presented the recording of humidity and temperature sensors during shipment. The total delivery time from the slaughterhouse to the market was 13 minutes, with data recorded every minute between 00:40 and 00:53 WIB (Indonesian time) or 17:40 and 17:53 UTC (Universal Time Coordinated).
Humidity played a crucial role in determining beef quality during shipping and was closely associated with temperature. As temperature rises, molecular condensation decreased humidity, as evidenced in the observation of Prakoso (2018). According to the FDA (2017), raw beef required cold storage and should not be left at room temperature for more than 2 hours, or at least 1 hour when the temperature was 90oF or 32oC. Despite the short delivery time by vehicle without cold storage, beef remained relatively safe based on the temperature and humidity sensor readings, qualifying as high-quality beef. Beef should be ideally stored and transported at cold temperatures below 4oC (chilling) or frozen below -18oC (freezing). Chilling beef below 4oC extended the shelf life to 3-5 days, while freezing below -18oC preserved it for 4-12 months (Jakubowski, 2015). Delivering beef in a refrigerated vehicle could help inhibit the growth of microorganisms.
Table 6 Temperature and humidity readings during beef delivery without cold storage.
Although this study conducted beef delivery without cold storage, the system's calculations and simulations validated the capability to identify halal and quality beef. RFID-based halal and quality traceability system could be adapted to monitor meat distribution, including cold storage, for future development. Further investigations were needed to test the system in cold storage settings to identify weaknesses and improve its effectiveness.
3.5. Implication on Halal and Quality Traceability System Development
RFID-based halal and quality traceability system developed in this study held promise for monitoring beef distribution. Despite being tested without cold storage, calculations and simulations showed the system's effectiveness in identifying halal and quality beef deliveries. Further investigations could potentially develop and test the system in beef distribution vehicle equipped with cold or freeze-storage capabilities, particularly in a long supply chain. RFID faced challenges including data transmission delays, unstable networks, and wiring issues, which could be addressed by improving antenna design to capture a more robust and better signal. Additional features such as LED lights could serve as indicators for vehicle drivers when the temperature and humidity levels exceed the predetermined limits.
In conclusion, RFID-based integrated halal and quality beef traceability system focused on the distribution process from the slaughterhouse to industrial consumers. The average temperature and humidity sensors for beef differed by ±3%, while GPS module had a valid RMSE of 0.1290. Simulation testing showed the system's ability to recognize tags with different product information, including between halal and haram materials, and presented the data on the dashboard. Further investigations were required to test the system's performance in both cold and freeze storage to improve it. Using additional features such as antenna and LED lights could enhance the system's functionality, particularly in monitoring temperature and humidity levels during transportation.
The study received funding from the Faculty of Agricultural Technology, Universitas Brawijaya, in 2021, under a doctoral grant [No. 1615/UN.10.F10/PN/2021].
Alfian, G, Syafrudin, M, Farooq, U, Ma’arif, MR, Syaekhoni, MA, Fitriyani, NL, Lee, J & Rhee, J 2020, ‘Improving efficiency of RFID-based traceability system for perishable food by utilizing IoT sensors and machine learning model’, Food Control, vol. 110, p. 107016, https://doi.org/10.1016/j.foodcont.2019.107016
Badan Standardisasi Nasional (BSN) 2018, ‘Pemotongan halal pada hewan ruminansia (halal slaughter for ruminant animals), SNI 99003:2018, Jakarta, Indonesia
Bazdaric, K, Sverko, D, Salaric, I, Martinovic, A & Lucijanic, M 2021, ‘The ABC of linear regression analysis: What every author and editor should know’, European Science Editing, vol. 47, https://doi.org/10.3897/ese.2021.e63780
Bhutta, MNM & Ahmad, M 2021, ‘Secure identification, traceability and real-time tracking of agricultural food supply during transportation using internet of things’, IEEE Access, vol. 9, pp. 65660–65675, 10.1109/ACCESS.2021.3076373
Bosona, T & Gebresenbet, G 2013, ‘Food traceability as an integral part of logistics management in food and agricultural supply chain’, Food Control, vol. 33, no. 1, pp. 32–48, https://doi.org/10.1016/J.FOODCONT.2013.02.004
Buskirk, DD, Schweihofer, JP, Rowntree, JE, Clarke, RH, Grooms, DL & Foster, TP 2013, ‘A traceability model for beef product origin within a local institutional value chain’, Journal of Agriculture, Food Systems, and Community Development, vol. 3, no. 2, pp. 33-43, https://doi.org/10.5304/jafscd.2013.032.007
Chin, CG, Jian, TJ, Ee, LI & Leong, PW 2022, ‘IoT-based indoor and outdoor self-quarantine system for COVID-19 patients’, International Journal of Technology, vol. 13, no. 6, pp. 1231-1240, https://doi.org/10.14716/ijtech.v13i6.5844
Expósito, I, Cuiñas, I & Gay-Fernández, JA 2013, ‘Efficient traceability solutions in the wine production by RFID and WSN’, 7th European Conference on Antennas and Propagation (EuCAP), pp. 3539-3542
Farooq, U, Tao, W, Alfian, G, Kang, Y-S & Rhee, J 2016, ‘ePedigree traceability system for the agricultural food supply chain to ensure consumer health’, Sustainability Journal, vol. 8, no. 9, pp. 839, https://doi.org/10.3390/su8090839
Fitriawan, D, Senov, HT & Permana, R 2020, ‘Pemanfaatan teknologi foto udara penginderaan jauh unmanned aerial vehicle (UAV) untuk pengumpulan data geospasial di area a warisan dunia tambang batubara ombilin sawahlunto (utilization of unmanned aerial vehicle (uav) remote sensing aerial photography technology for geospatial data collection in area a world heritage ombilin sawahlunto coal mine)’, Jurnal Azimut, vol. 3, no. 1, pp. 37-50, https://ojs.unitas-pdg.ac.id/index.php/azimut/article/view/656
Food and Drug Administration (FDA) 2017, Refrigerator Thermometers: Cold Facts about Food Safety, Food Facts Article, USA, viewed 12 June 2022, (https://www.fda.gov/media/80676/download#:~:text=Never%20allow%20raw%20meat%2C%20poultry,refrigeration%2C%20ask%20your%20grocer)
Gautam, R, Singh, A, Karthik, K, Pandey, S, Scrimgeour, F & Tiwari, MK 2017, ‘Traceability using RFID and its formulation for a kiwifruit supply chain’, Computers & Industrial Engineering, vol. 103, pp. 46-58, https://doi.org/10.1016/j.cie.2016.09.007
Gudavalli, GS & Dhakal, TP 2018, ‘Emerging materials for energy conversion and storage’, Elsevier Publisher, pp. 247-301
Hadi, DK, Santoso, PB & Sucipto, 2019, ‘Traceability implementation based on RFID at agro-industry: A review’, IOP Conference Series: Earth and Environmental Science, vol. 230, p. 012070, 10.1088/1755-1315/230/1/012070
Haleem, A, Khan, S & Khan, MI 2019, ‘Traceability implementation in food supply chain: A grey-DEMATEL approach’, Information Processing in Agriculture, vol. 6, no. 3, pp. 335–348, https://doi.org/10.1016/J.INPA.2019.01.003
Hendrarini, N, Asvial, M & Sari, RF 2021, ‘Wireless sensor networks optimization with localization-based clustering using game theory algorithm’, International Journal of Technology, vol. 13, no. 1, pp. 213-224, https://doi.org/10.14716/ijtech.v13i1.4850
Isyanto, H, Jumail, Rahayu & Firmansyah, N 2021, ‘Design of monitoring device for the process of organic waste decomposition into compost fertilizer and plant growth through smartphones based on internet of things smart farming’, Journal of Electrical Technology UMY, vol. 5, no. 2, pp. 52-60, https://doi.org/10.18196/jet.v5i2.12815
Jakubowski, T 2015, ‘Temperature monitoring in the transportation of meat products’, Journal Food Process Technology, vol. 6, no. 10, p. 502, 10.4172/2157-7110.1000502
Kambezidis, HD 2012, ‘The solar resource’, Comprehensive Renewable Energy, vol. 3, pp. 27-84, https://doi.org/10.1016/B978-0-08-087872-0.00302-4
Kharisma, OB, Mustakim, DAA, Vebrianto, R, Novita, R, Hasbullah, Irawati, Novita, Y, Zaitun, Nazir, A, Iskandar, I, Vitriani, Y, Rehayati, R & Andriani, T 2019, ‘Development of location tracking system via short message service (SMS) based on GPS unblox Neo-6m and Sim 800l module’, Journal of Physics: Conference Series, vol. 1363, no. 1, p. 012002, http://dx.doi.org/10.1088/1742-6596/1363/1/012002
Kurniawan, A, Taufik, M & Yudha, IS 2015, ‘Pengaruh jumlah dan sebaran GCP pada proses rektifikasi citra worldview II (studi kasus: Kota Kediri, Jawa Timur) (the influence of the number and distribution of GCPs on the worldview II image rectification process (case study: Kediri City, East Java))’, Jurnal Geoid, vol. 11, no. 1, pp. 67-74, http://dx.doi.org/10.12962/j24423998.v11i1.1101
Mainetti, L, Mele, F, Patrono, L, Simone, F, Stefanizzi, ML & Vergallo, R 2013, ‘An RFID-based tracing and tracking system for the fresh vegetables supply chain’, International Journal of Antennas and Propagation, vol. 2013, pp. 1-15, https://doi.org/10.1155/2013/531364
Millard, P, Paine, S, O'Hagan, S & Hipkiss, J 2015, ‘Traceability of allergenic foods in the food chain’, Handbook of Food Allergen Detection and Control, Woodhead Publishing, Cambridge, England, pp. 19–40, https://doi.org/10.1533/9781782420217.1.19
Ministry of Agriculture Republic of Indonesia 2018, Indonesia Mampu Penuhi Protein Hewani Dalam Negeri (Indonesia can Fulfill Domestic Animal Protein), viewed 26 August 2022 (https://www.pertanian.go.id/home/?show=news&act=view&id=3962#:~:text=Konsumsi%20per%20kapita%20Indonesia%20berada,terbanyak%20di%20ASEAN%20hingga%2069%25)
Mishra, KD, Henry, S, Sekhari, A & Ouzrout, Y 2015, ‘Traceability as an integral part of supply chain logistics management: An analytical review’, 7th International Conference on Logistics and Transport (ICLT 2015), November 2015, Lyon, France, http://arxiv.org/abs/1811.06358
Nasution, TH & Harahap, LA 2020, ‘Predict the percentage error of LM35 temperature sensor readings using simple linear regression analysis’, 4rd International Conference on Electrical, Telecommunication and Computer Engineering (ELTICOM), September 2020, pp. 242-245, https://doi.org/10.1109/ELTICOM50775.2020.9230472
Papetti, P, Costa, C, Antonucci, F, Figorilli, S, Solaini, S & Manesatti, P 2012, A RFID web-based infotracing system for the artisanal italian cheese quality traceability’, Food Control, vol. 27, no. 1, pp. 234-241, https://doi.org/10.1016/j.foodcont.2012.03.025
Patidar, A, Sharma, M & Agrawal, R 2021, ‘Prioritizing drivers to creating traceability in the food supply chain’, Procedia CIRP, pp. 98, pp. 690–695, https://doi.org/10.1016/j.procir.2021.01.176
Prakoso, D 2018, ‘Analisis pengaruh tekanan udara, kelembaban udara dan suhu udara terhadap tingkat curah hujan di Kota Semarang (analysis of the effect of air pressure, air humidity and air temperature on rainfall levels in Semarang City), Bachelor's Thesis, Faculty of Math and Science, Universitas Negeri Semarang
Qian, J-P, Yang, X-T, Wu, X-M, Zhao, L, Fan, B-L & Xing, B 2012, ‘A traceability system incorporating 2D barcode and RFID technology for wheat flour mills’, Computers and Electronics in Agriculture, vol. 89, pp. 76-85, https://doi.org/10.1016/j.compag.2012.08.004
Rachmanto, DH & Ihsan, M 2020, ‘Pemetaan metode fotogrametri untuk pemetaan skala 1:1000 (studi kasus: Universitas Pendidikan Indonesia) (mapping photogrammetric methods for mapping scale 1:1000 (case study: Universitas Pendidikan Indonesia))’, Jurnal ENMAP, vol. 1, no. 2, pp. 81-86, https://ejournal.undiksha.ac.id/index.php/ENMAP/article/view/28173
Sobral, JVV, Rodrigues, JJPC, Rabelo, RAL, Lima Filho, JC, Sousa, N, Araujo, HS & Holanda Filho, R 2018, ‘A framework for enhancing the performance of internet of things applications based on RFID and WSNs’, Journal of Network and Computer Applications, vol. 107, pp. 56–68, https://doi.org/10.1016/J.JNCA.2018.01.015
Sun, C 2012, ‘Application of RFID technology for logistics on internet of things’, AASRI Procedia, vol. 1, pp. 106–111, https://doi.org/10.1016/J.AASRI.2012.06.019
Syahputri, BE & Sucipto, S 2021, ‘Monitoring of Beef cold chain to ensure quality, safety, and halal using RFID: A review’, IOP Conference Series: Earth and Environmental Science, vol. 924, p. 012001, https://doi.org/10.1088/1755-1315/924/1/012001
Trebar M 2015, ‘RFID logistic management with cold chain monitoring–cold store case study’, World Academy of Science, Engineering and Technology, International Journal of Social, Behavioral, Educational, Economic, Business and Industrial Engineering, vol. 9, no. 3, pp. 736-739, https://doi.org/10.5281/zenodo.1099444
Wibisono, AD & Setiawan, EA 2015, ‘New approach to determining mathematical equations for optimum tilt angle of solar panels in indonesia and its economic impact’, International Journal of Technology, vol. 6, no. 2, pp. 180-189, https://doi.org/10.14716/ijtech.v6i2.988